LV Purchasing & Employment Plans Index
Local businesses’ index of planned expenditures for the next 6 months leaped 9.5%.
KAA surveys Lehigh Valley businesses on a quarterly basis and collects around 800 observations per year. The Employment and Purchasing Index for the Lehigh Valley highlights the results of these surveys. In July 2013 we conducted our 55th survey of this series. The following is a summary of our findings.
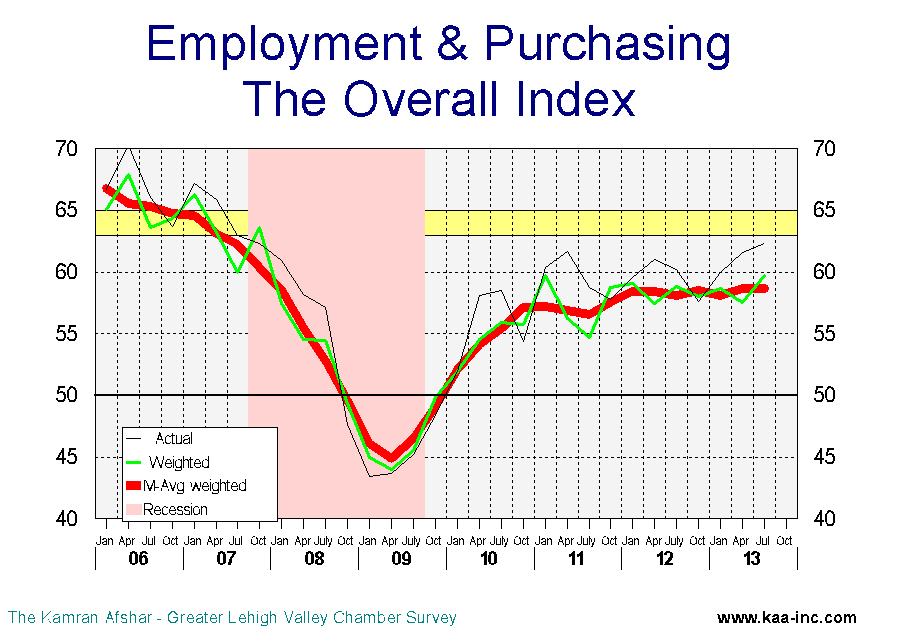
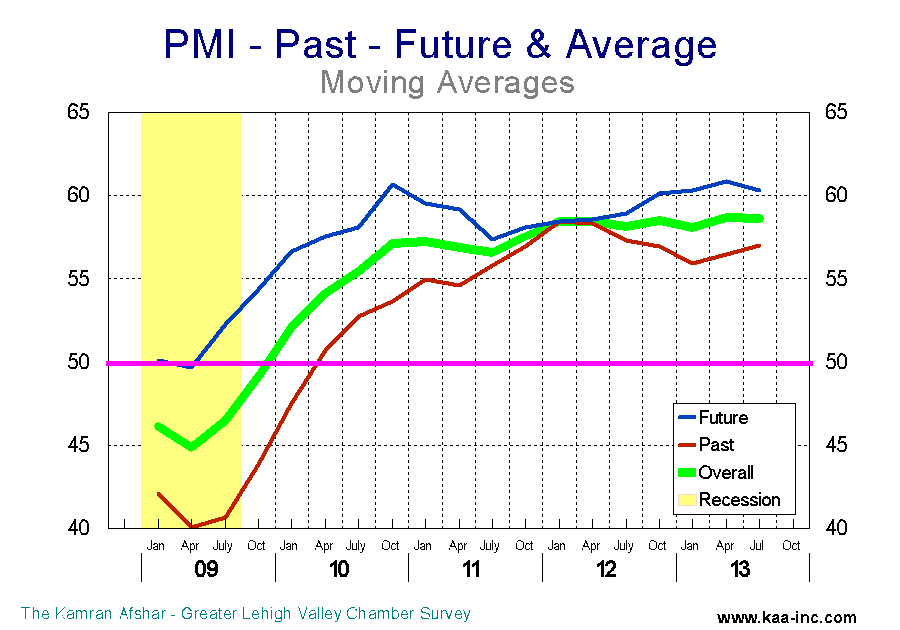
Business sentiment, as measured by the overall index rose slightly to 59.7 (seasonally adjusted weighted average, SAWA) in July 2013, a 3.7% increase over April 2013 and 1.4% over July 2012 levels. This is the second time the overall index has reached this point since October 2007. Any index above 50 means more than half of the participants were positive about the economy.
In general, participants were more positive about the future than the past. This is not dissimilar to the January survey results whereby participants were also more positive about the future than the past.
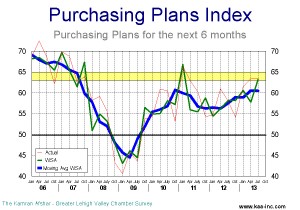
The largest gain as measured against April and also July 2012 was in the index for planes for future expenditures which leaped by 9.5% and 8.7% respectively.
The index of purchasing plans for the next 6 months soared to 63.3, a gain of 9.5% over April and 8.7% over July 2012 levels, the second highest level since October 2007. The average business participating in the survey increased its expenditure plans for the next 6 months by 1.9% (moving average).
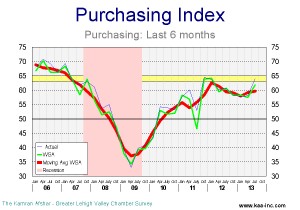
The second largest gain in July was in actual expenditures during the last six months. This index rose 7.7% above its April level. However, it is only 2.0% above its July 2012 level.
The index of actual expenditures over the last 6 months rose slightly to 61.9 (SAWA) in July 2013. This index rose to 64.2 in January 2012. Lehigh Valley companies began to increase their expenditures from the middle of 2011 at an increasing rate through July 2012. Then the index, while still in positive territory started to decline, dropping to 56.3 by April 2013. July was the first significant increase in the index since October 2011.PMI3 In January 2013, the average participant in our survey raised its expenditures by zero percent, compared to the previous 6 months. This indicator saw a sharp rebound in April when the average participant raised its expenditure by 1.7%, and in July this number rose to 1.8%. We expect to see more increases in this indicator over the balance of 2013.
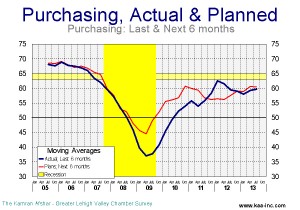
Between October 2011 and October 2012 planned increases for future purchases dropped below actual increases in past expenditures. This was quite disconcerting because it indicates an expectation of worsening economic conditions in the future.
However, the good news is that for the last three quarters, the order has been restored and planned increases are again running above actual increases in each quarter.
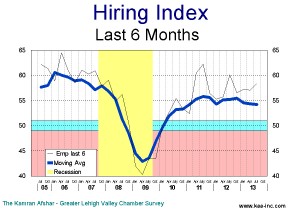
The index of “how many people did you hire in the last six months” rose slightly to 54.5 (SAWA) from 54.0 in April. It is still 3.9% below July 2012. While this index is generally rising, it is two steps forward one step back, which is of course better than all steps backward.PMI5
Despite that, between April and June 2013, there were 3,600 (seasonally adjusted) Jobs created in the Valley, which is in line with our April 2013 forecast of 6,600 new jobs in the following six months.
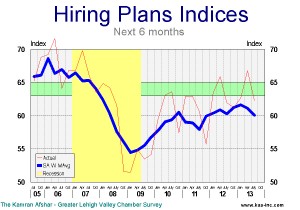
The only indicator which dropped below its April 2013 level was “plans for future hiring” this index dropped by 3.1% indicating concern among local businesses about the future of the economy. This index has been dropping since January 2013. It should be noted that while this number is below January and April levels, it is still in the positive, indicating that businesses are planning to hire more people, just not as many as they thought earlier this year.
Local businesses are planning to increase employment significantly over the next 6 months. The average participant in the survey is planning to add 0.6 employees in the next 6 months. This translates to 5,200 new employees over the next 6 months.
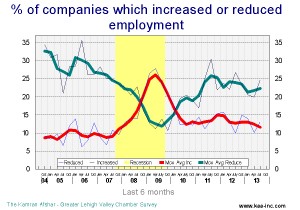
The percentage of the companies which increased their employment has been exceeding those who reduced theirs since April 2010. And, in general, the percent of those increasing has gone up more than down since the end of the recession. Conversely, the percentage of those decreasing employment has gone down more than up during the same period.
The percentage of companies with net gain in employment has increased steadily during the last 3 quarters.
In the previous issue we referred to local businesses changing their assessment of the past and future of the economy in a positive way. We have more evidence that the trend is continuing. This is the fifth quarter in a row when expectations of the future exceeds the assessment of the past. Since the beginning of this year, assessment of the past is also starting to slowly improve.
We expect the Valley’s economy to continue its positive improvement over the next 6 months. And expect local companies to significantly increase their expenditures as well as local employment to also show a sizable increase in the next 6 months.
Overall, our expectation for this fall is a brighter economy.