LV Purchasing & Employment Plans Index
Valley businesses planning to hire 6,600 new employees in the next 6 months.
KAA surveys Lehigh Valley businesses on a quarterly basis and collects around 700 observations per year. The Employment and Purchasing Index for the Lehigh Valley highlights the results of these surveys. In April 2013 we conducted our 54th survey of this series. The following is a summary of our findings.
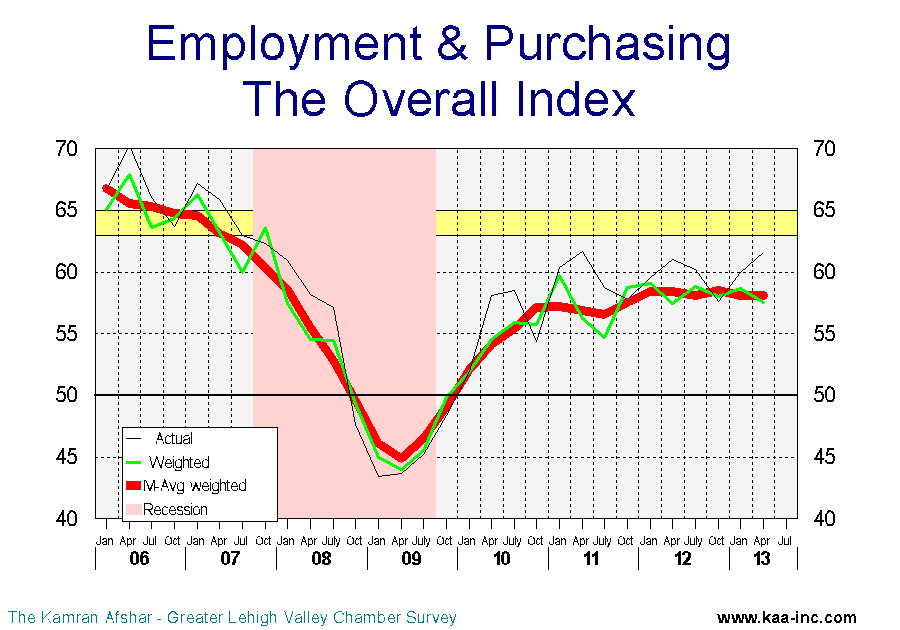
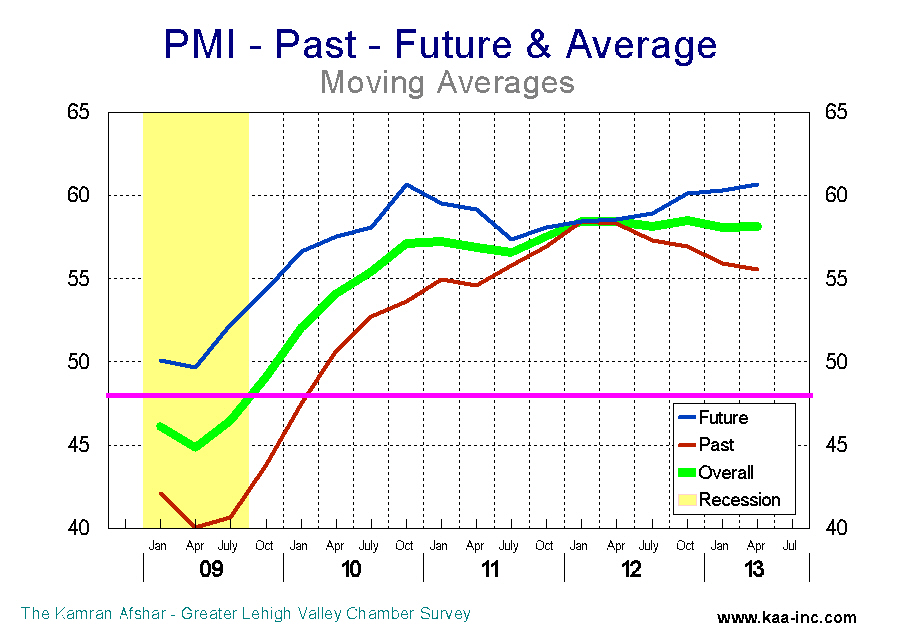
Business sentiment, as measured by the overall index dropped slightly to 57.6 (seasonally adjusted weighted average, SAWA) in April 2013, a 1.9% decline below its January 2013 level. This index has been oscillating between 57.4 and 59.1 since October 2011. Any index above 50 means more than half of the participants were positive about the economy.
This is not dissimilar to the January survey results whereby participants were significantly more positive about the future than the past.
One of the indicators which has shown some decline is the hiring index which shows the number of people who where hired by the participants in the survey. This index, while still in the positive, has dropped 4.8% below its July 2012 level.
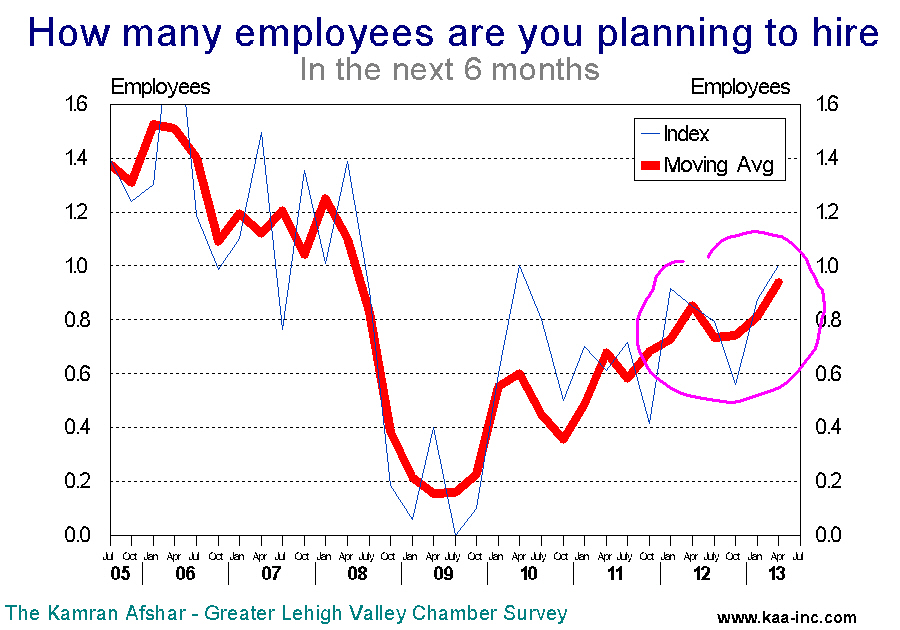
The average participant in the survey had hired 0.4 new employees, which is slightly lower than the post-recessionary average of 0.6 new employees.
Local businesses are planning to increase employment significantly over the next 6 months. The average participant in the survey is planning to add one more employee in the next 6 months. This translates to 6,600 new employees which translates to a 4.2% increase at annual rates. This indicator is at its highest point since 2007.
Both the short and long-term moving averages indicate a sustained trend which began January 2011 and is continuing. The initial increase in employment wasn’t as robust as the planned since January 2011. Between the first quarter of 2011 and the first quarter of 2012, employment in the Lehigh Valley rose by 3,400 jobs, although businesses did plan to hire 7,300 new employees for that period. But that changed, between then and the first quarter of 2013 the Valley’s employment rose by 9,300, very close to what local businesses had planned which was 9,900 new employees. Based on historical data, local employers usually over-estimate how many people they are going to hire, however, with few exceptions like 2011, their plans are generally not that far off the mark.
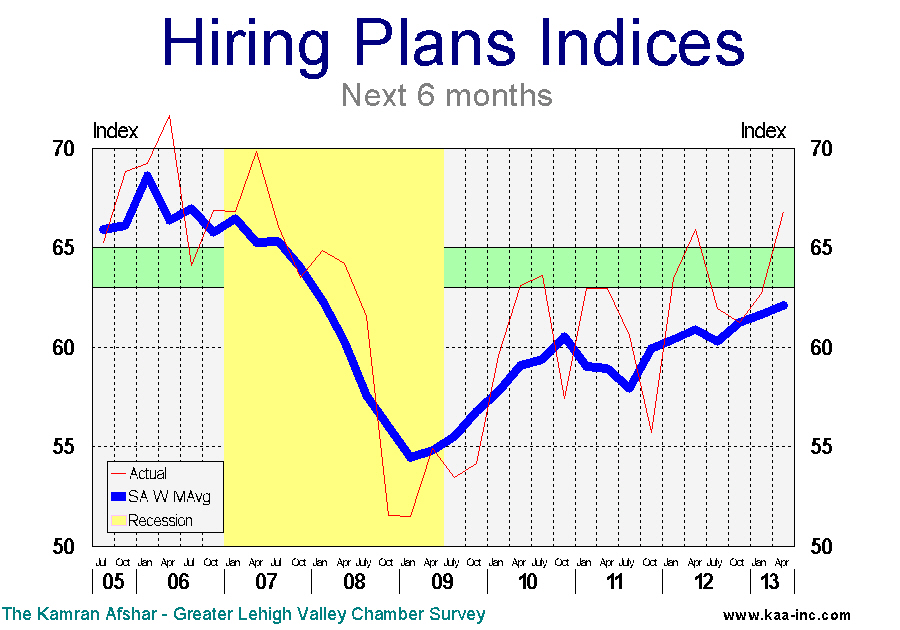
The index of plans for future hiring has been oscillating between 59.8 and 63.2 since last April. In April 2013 it stood at 61.0 demonstrating an overall positive attitude by employers, however, it is still short of the exuberant positive level which starts at 65.0. It should be noted that the unadjusted indicator stood at 66.8, the highest for this indicator since 2007.
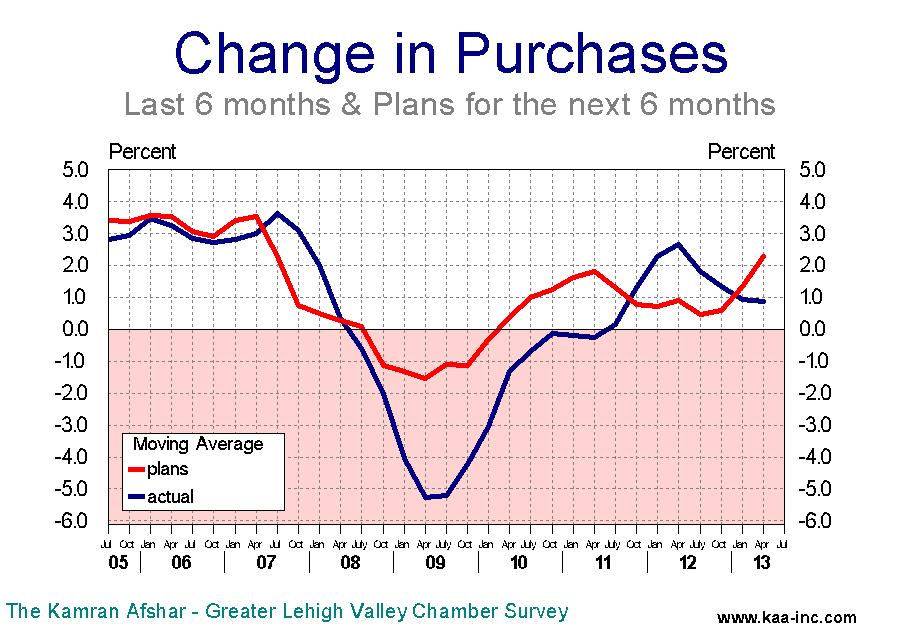
The index of purchasing plans for the next 6 months gave up all its gains for the last 12 months and dropped to 57.8 (SAWA). This index has been going mostly sideways for the last 12 months. However, the average business participating in the survey increased their expenditures plans for the next 6 months from 1.7% in January to 2.8% in April . This number is also more than double the April 2012 level of 1.3%. Indicating that while the number of companies which are planning to increase their expenditures may have not increased significantly, those who were planning to increase their expenditures have upped their plans.
The index of actual expenditures over the last 6 months rose slightly to 57.5 (SAWA) in April 2013. This index also has been oscillating within a narrow band between 56.3 to 60.7 over the last 12 months. Lehigh Valley companies started to increase their expenditures from the middle of 2011 at an increasing rate through July 2012. From then, while increasing expenditures, they were doing it at reduced rates. In January 2013, the average participant in our survey raised their expenditures by zero percent, compared to the previous 6 months. This indicator saw a sharp rebound in April when the average participant raised their expenditure by 1.7% compared to the previous 6 months. We expect to see more increases in this indicator over the balance of 2013.
Between October 2011 and October 2012, planned raises were less than actual increases in expenditures. This was quite disconcerting since the last time we saw such a persistent reversal of normal trends was in July 2007 right before the recession. However, the good news is that for the last two quarters, the order has returned to this indicator and plan increases are again running above actual increase in each quarter.
In the previous issue we referred to businesses changing their assessment of the past and future of the economy in a positive way. We have more evidence that the trend is continuing. While the two indices did not present any difference for a good part of 2012, they have been separating from one another since the end of last year with a better expectation of the future than their assessment of the past. The difference between the two indices started in the 4th quarter of 2012 and is expected to expand; indicating that local businesses believe that the economy’s near future is brighter than its past.
Based on these data it is our expectation that the Valley’s economy will do much better in the next 6 months, especially with a significant increase in employment. We also expect to see local companies continue to increase their purchases at much higher rates than in the past 12 months. Overall, our expectation is for brighter economic situation by summer’s end.