


The number of housing starts in the Valley has collapsed. What does this mean for the future of our housing market?
Housing starts which is a short-term leading indicator of the housing market used to run at around 400 new starts a month during the boom years of 2004 – 2005 in the ABE metropolitan statistical area (ABE MSA). When the bubble bursted, the number of new housing starts crashed from 400 all the way down to around 100 by 2008.
That was the Great Recession and the expectations were that as soon as things get back to normal, housing starts will also move back up to its previous levels.
Well, it didn’t work exactly that way. Housing starts in the Valley continued to drop, albeit at a much slower pace all the way through 2011 falling to 75 new starts a month in the ABE MSA.
After 2011 things started to look better and the number of starts rose slowly to 100 by middle of 2013. It looked as if the long awaited recovery in the new starts in the ABE MSA had started. Of course we didn’t expect the 400 new starts of 2004 -2005 period because that was during the bubble. The expectations was to get to around 150 new starts a month, which, of course, didn’t happen. And that was not all, from the middle of 2013 the new starts, instead of continuing to go up, started to slowly ease down. By summer of 2014 we were at around 90 new starts a month.
Totally contrary to expectation, since the economy was doing better, mortgage rates were still very low and number of housing sales in the Valley was continuing up.
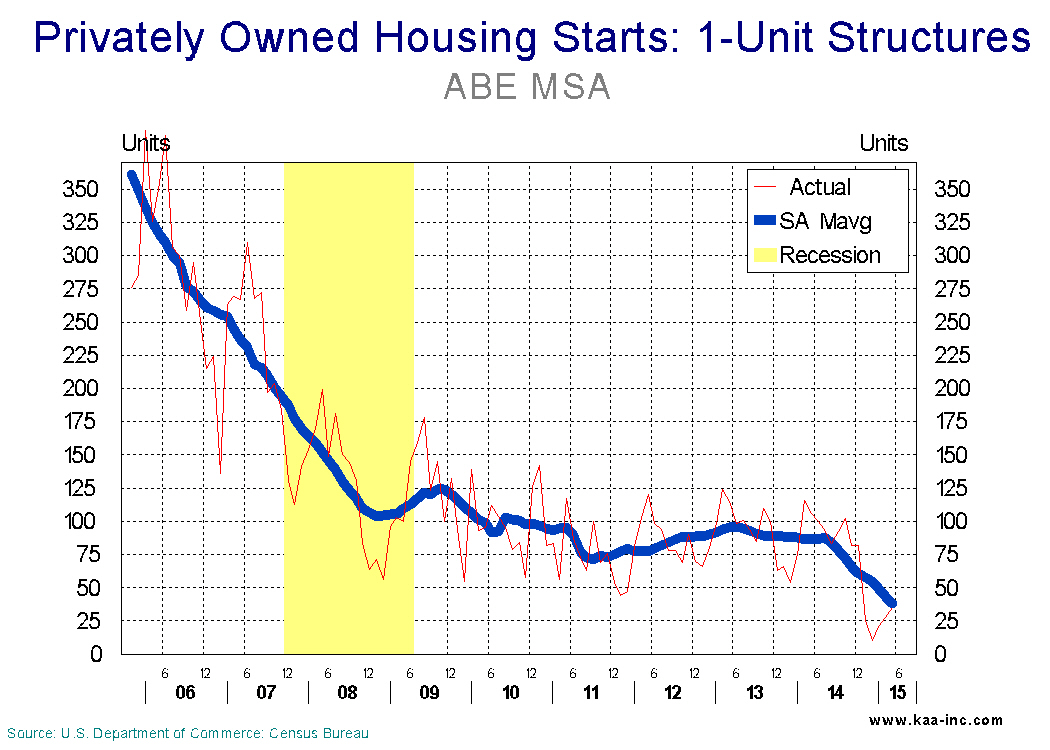
The housing starts dropped to 90 by summer 2014. And as if that was not enough of a puzzle, the number of new starts in the Valley then crashed all the way down to 35 by May 2015. It should be noted that the average number of new starts in the Valley for the month of May in the last 6 years was 109. For the period we call the “normal” that is most of the 1990s, average number of new starts in the month of May was 190 in the ABE MSA. Also, at the national average, the number of new building starts has been rising since 2010.
The total number of new housing starts in the ABE MSA for the first 5 months of this year is 119, less than a third of 417 new starts during the same period of 2014. And to add insult to injury at the national level during the same period of this year, the number of new starts has increased by 7.1% above its 2014 level. New starts at the national level has been rising since 2011.
A precursor to new starts is building permits, this indicator has also been falling since 2013 in the ABE MSA. The number of deeds registered is a long term predictor of the housing market, this indicator also dropped in 2013, but has recovered its losses this year.
The data clearly indicates that the number of new houses built in the ABE MSA has dropped dramatically in the last 12 months, and data from permits indicates that this trend may not reverse itself in the next few months. While this may be good news for those who have their houses on the market, since it means fewer brand new houses are being built to compete with the existing houses on the market, for the overall economy it is a cause for concern!