


Author Archives: admin
Local Businesses are planning to increase their expenditures over the next 6 months.
The Kamran Afshar- Greater Lehigh Valley Chamber of Commerce survey of Lehigh Valley businesses is done on a quarterly basis and collects around 700 observations per year. The Employment and Purchasing Index for the Lehigh Valley highlights the results of these surveys.
In July 2016 we conducted our 67th quarterly survey of these series, and according to the survey, business sentiment and the overall confidence in the local economy remained the same as in April, however, it is slightly lower than its January level. The index peaked back in October 2015.
.
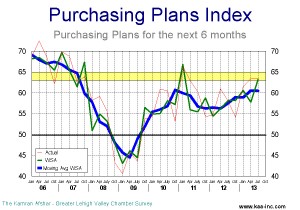
In July, the index of plans for future purchases rose by a significant 5% above its April’s level. And while it is still lower than its January’s level, some of its April decline has been reversed.
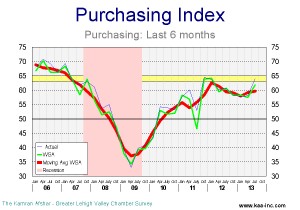
Actual expenditures over the last 6 months, however, have been trending down since last October.
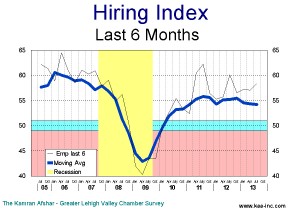
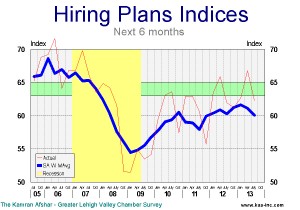
Hiring plans index for the next 6 months, is a shade higher than its April level, however, it has been trending at an almost constant level for the last year-and-a-half. And of more importance, this level is very close to the range which is historically associated with strong employment growth.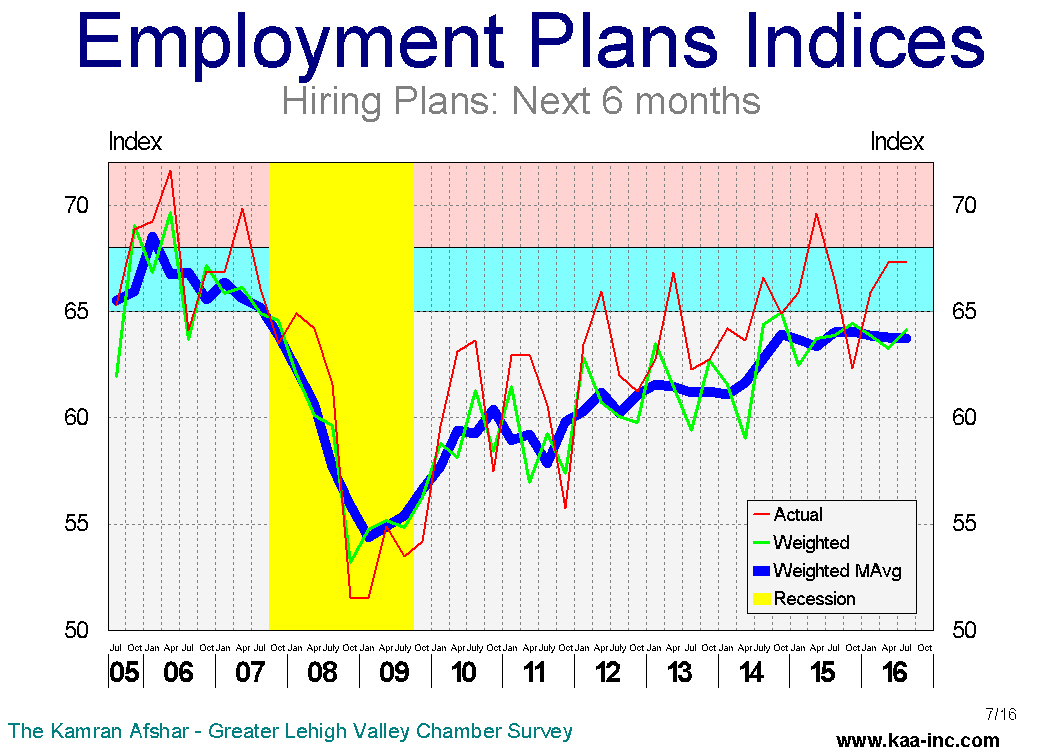 A third of local businesses are planning to hire more people, while only 5% of them plan to lay off employees in the next 6 months. The layoff plans are now similar to what they used to be before the recession.
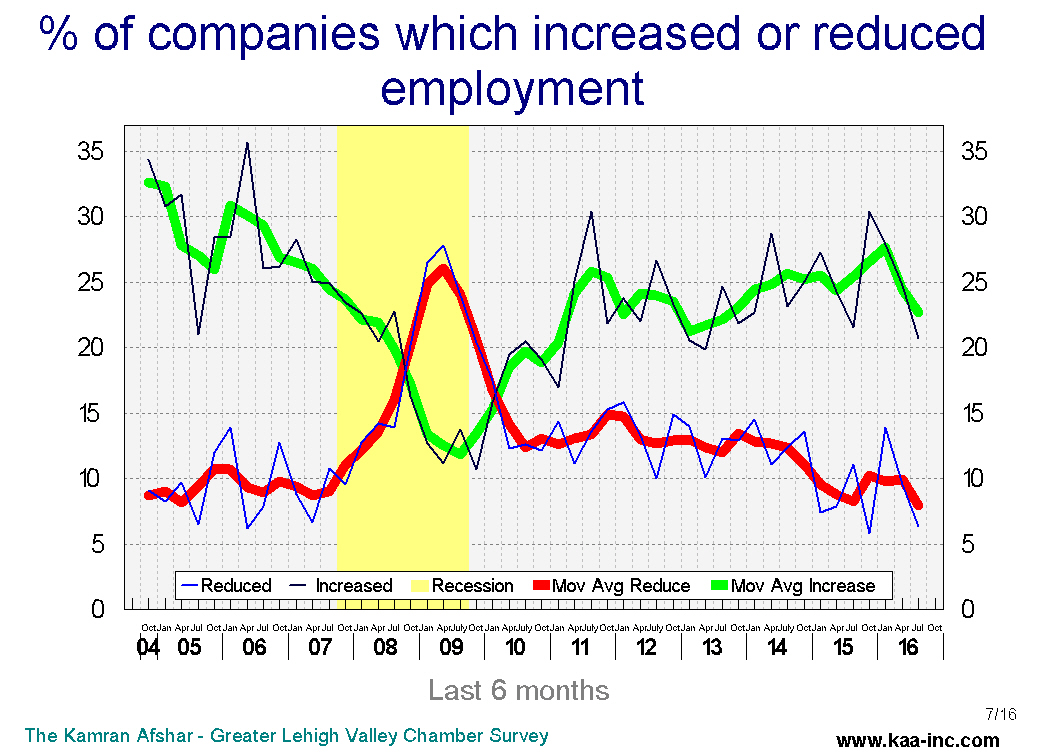
Businesses with more than 100 employees, followed by those with 21 to 50 employees are planning to hire more people in the next 6 months than others.
Similar to the future plans for hiring, the actual hiring index over the last 6 months was almost the same as its April level, but unlike the future hiring plans, the actual hiring index has dropped below its January level.
In July businesses with more than 100 employees reported hiring more people in the last 6 months than the others.
The index of expected revenues is continuing its rebound from its January lows and it is running at its highest level over the last 5 quarters.
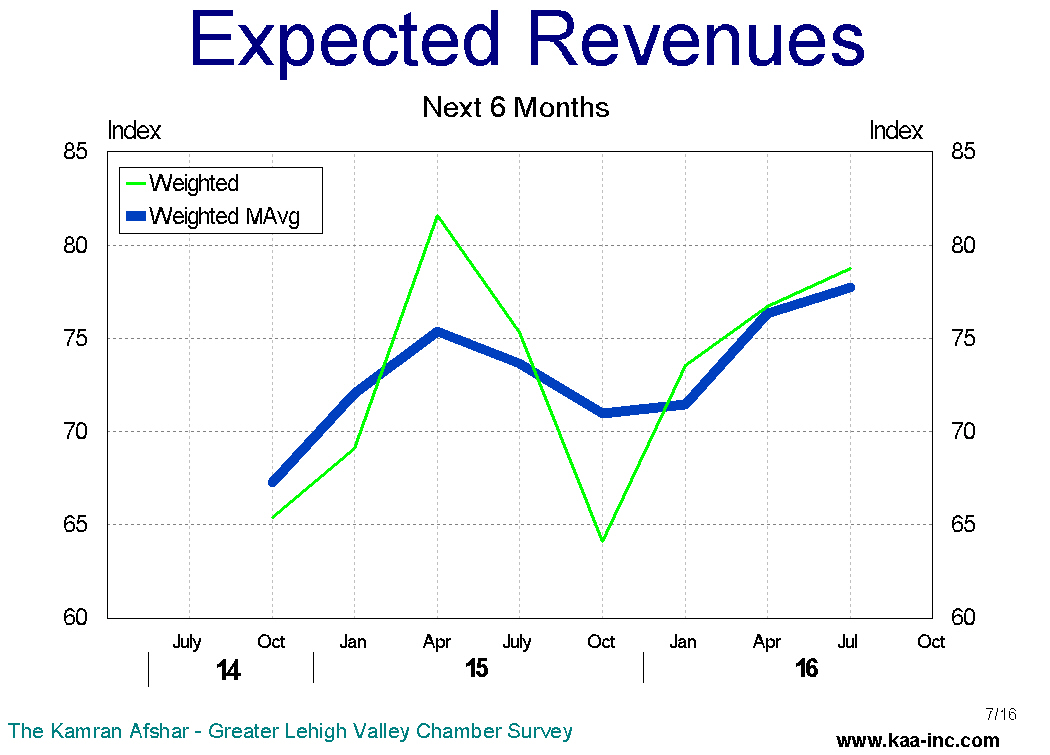
The index of actual revenues, rose above its April level, however, it is still running below its January 2016 level.
The overall confidence in the local economy has dropped since last October and some of this decline can be attributed particularly to the increase in the level of uncertainty generated by this election process. We have observed declines in business confidence in previous general elections over the last 16 years. The Valley’s economy is expected to suffer some anxiety over the next few months as election campaigns further ratchet up their activities. However, since our labor market is running close to where it was during the tight labor markets of 1999-2000 and 2004-05 and an increasing number of businesses are reporting more unfilled job openings, it appears that we would weather this election with minimal, if any negative economic impact locally
This Week’s Economic Pulse
October 11, 2013
In this week’s Economic Pulse, Dr. Kamran Afshar gives us a synopsis of the week’s economic news, and takes a detailed look at trends in the Lehigh Valley, and important issues to watch in the coming week.”
WDIY
to listen to the 4 minute program click on the following.
http://wdiy.org/post/weeks-economic-pulse-1
About KAA – The Market Research Firm
KAA (http://kaa-inc.com) offers scientific multi-media market research and customer satisfaction studies. Operating since 1988, we have developed a systematic way of predicting and preventing customer flight and increasing our clients’ customer bases. Our Ph.D. led initiatives provide scientifically accurate and statistically significant results that turn customers into raving fans.
This Week’s Economic Pulse
The stock market which rose by more than one percent on the 18th on the news that the Federal Reserve was not going to start tapering in September, gave up all of its gains and then some on the newer news that we may be facing a government shutdown next week and then yet again another battle over the debt ceiling in a couple weeks after that. As of this taping the Dow Jones Industrial Average has lost around 3% from its September 18th close.
The last federal government shutdown in 1995 cost more than 1.2 billion dollars, and of course you know who paid the price, we the tax payers!
Ok, now let’s turn to something less depressing, as if that is possible for economists!!
In this case, there is an exception;
The Lehigh Valley’s housing market has been doing fairly well lately and the outlook is even more encouraging. One of the most important indicators of the housing market is sales volume, during the last housing boom, sales volume reached 9,000 units a year in the Valley. The Great Recession cut that into half.
At the height of the housing market, in 2005-2006, the level of monthly transaction in the Valley exceeded 160 million dollars. During the Great Recession housing demand dropped to less than 80 million dollars a month, a huge drop.
So where is the good news?
The facts show that the Valley’s housing market has shown significant recovery, and volume of sale has now exceeded 6,000 units a year, which is a lot more in line with the historical sales volumes for the Valley than the over heated 9,000 ever was.
Now, all this is about looking in the rear view mirror, this is all in the past, what about the future? Well let me share a trade secret with you, economists are great in analyzing what happened, what is going to happen, is a different story, however, that technicality has rarely prevented us from making forecasts!!
For the Lehigh Valley I have used three basic indicators to forecast the future of the housing market in the last two decades, the short term indicator, 3 to 6 months ahead, is yet to show any upward enthusiasm, the medium term indicator, 9 to 12 months ahead, is moving up from its lows and is showing some life. The long term indicator, more than 12 months hence, on the other hand, is showing significant increases. This simply means that the Valley’s housing market will show real improvement by the end of next summer.
to listen to the program click on the following
NEW Feature Program Begins Friday – Economic Pulse with Dr. Kamran Afshar
September 16, 2013
from: WDIY Program Highlights

Economic Pulse with Dr. Kamran Afshar will be a synopsis of the week’s economic news, with a detailed look at trends in the Lehigh Valley, and important issues to watch in the coming week.
LV Purchasing & Employment Plans Index
Local businesses’ index of planned expenditures for the next 6 months leaped 9.5%.
KAA surveys Lehigh Valley businesses on a quarterly basis and collects around 800 observations per year. The Employment and Purchasing Index for the Lehigh Valley highlights the results of these surveys. In July 2013 we conducted our 55th survey of this series. The following is a summary of our findings.
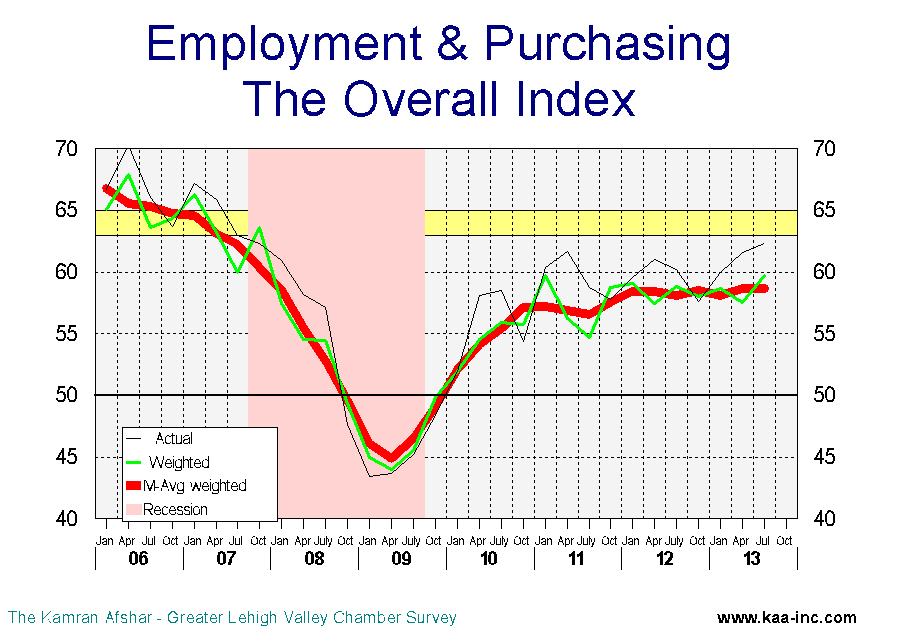
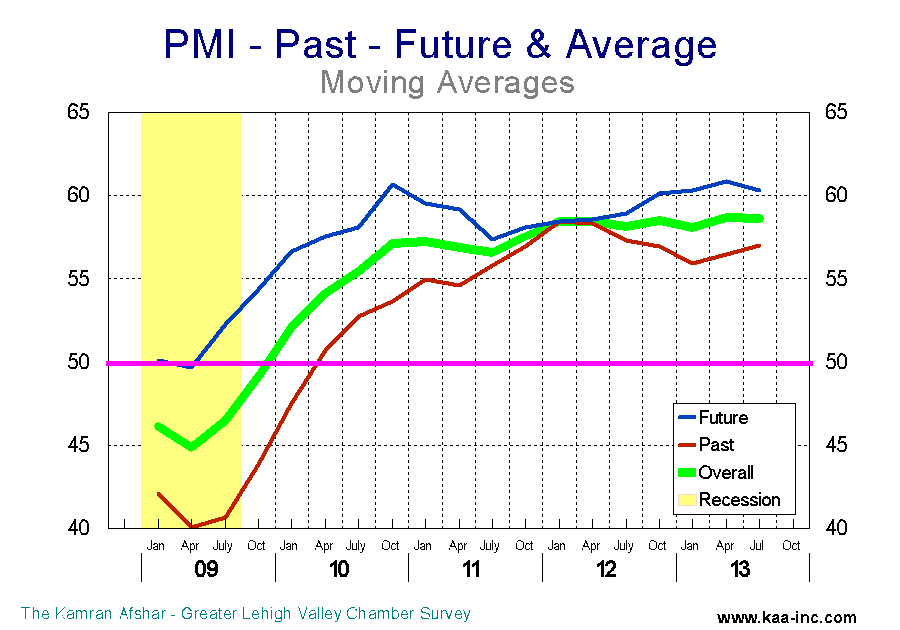
Business sentiment, as measured by the overall index rose slightly to 59.7 (seasonally adjusted weighted average, SAWA) in July 2013, a 3.7% increase over April 2013 and 1.4% over July 2012 levels. This is the second time the overall index has reached this point since October 2007. Any index above 50 means more than half of the participants were positive about the economy.
In general, participants were more positive about the future than the past. This is not dissimilar to the January survey results whereby participants were also more positive about the future than the past.
The largest gain as measured against April and also July 2012 was in the index for planes for future expenditures which leaped by 9.5% and 8.7% respectively.
The index of purchasing plans for the next 6 months soared to 63.3, a gain of 9.5% over April and 8.7% over July 2012 levels, the second highest level since October 2007. The average business participating in the survey increased its expenditure plans for the next 6 months by 1.9% (moving average).
The second largest gain in July was in actual expenditures during the last six months. This index rose 7.7% above its April level. However, it is only 2.0% above its July 2012 level.
The index of actual expenditures over the last 6 months rose slightly to 61.9 (SAWA) in July 2013. This index rose to 64.2 in January 2012. Lehigh Valley companies began to increase their expenditures from the middle of 2011 at an increasing rate through July 2012. Then the index, while still in positive territory started to decline, dropping to 56.3 by April 2013. July was the first significant increase in the index since October 2011.PMI3 In January 2013, the average participant in our survey raised its expenditures by zero percent, compared to the previous 6 months. This indicator saw a sharp rebound in April when the average participant raised its expenditure by 1.7%, and in July this number rose to 1.8%. We expect to see more increases in this indicator over the balance of 2013.
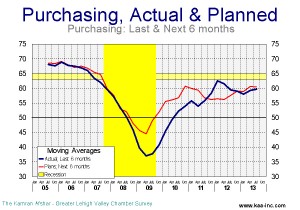
Between October 2011 and October 2012 planned increases for future purchases dropped below actual increases in past expenditures. This was quite disconcerting because it indicates an expectation of worsening economic conditions in the future.
However, the good news is that for the last three quarters, the order has been restored and planned increases are again running above actual increases in each quarter.
The index of “how many people did you hire in the last six months” rose slightly to 54.5 (SAWA) from 54.0 in April. It is still 3.9% below July 2012. While this index is generally rising, it is two steps forward one step back, which is of course better than all steps backward.PMI5
Despite that, between April and June 2013, there were 3,600 (seasonally adjusted) Jobs created in the Valley, which is in line with our April 2013 forecast of 6,600 new jobs in the following six months.
The only indicator which dropped below its April 2013 level was “plans for future hiring” this index dropped by 3.1% indicating concern among local businesses about the future of the economy. This index has been dropping since January 2013. It should be noted that while this number is below January and April levels, it is still in the positive, indicating that businesses are planning to hire more people, just not as many as they thought earlier this year.
Local businesses are planning to increase employment significantly over the next 6 months. The average participant in the survey is planning to add 0.6 employees in the next 6 months. This translates to 5,200 new employees over the next 6 months.
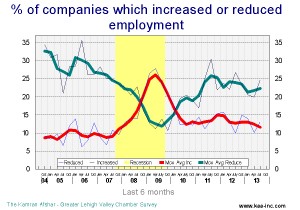
The percentage of the companies which increased their employment has been exceeding those who reduced theirs since April 2010. And, in general, the percent of those increasing has gone up more than down since the end of the recession. Conversely, the percentage of those decreasing employment has gone down more than up during the same period.
The percentage of companies with net gain in employment has increased steadily during the last 3 quarters.
In the previous issue we referred to local businesses changing their assessment of the past and future of the economy in a positive way. We have more evidence that the trend is continuing. This is the fifth quarter in a row when expectations of the future exceeds the assessment of the past. Since the beginning of this year, assessment of the past is also starting to slowly improve.
We expect the Valley’s economy to continue its positive improvement over the next 6 months. And expect local companies to significantly increase their expenditures as well as local employment to also show a sizable increase in the next 6 months.
Overall, our expectation for this fall is a brighter economy.
Are the new jobs created after the recession mostly full-time?
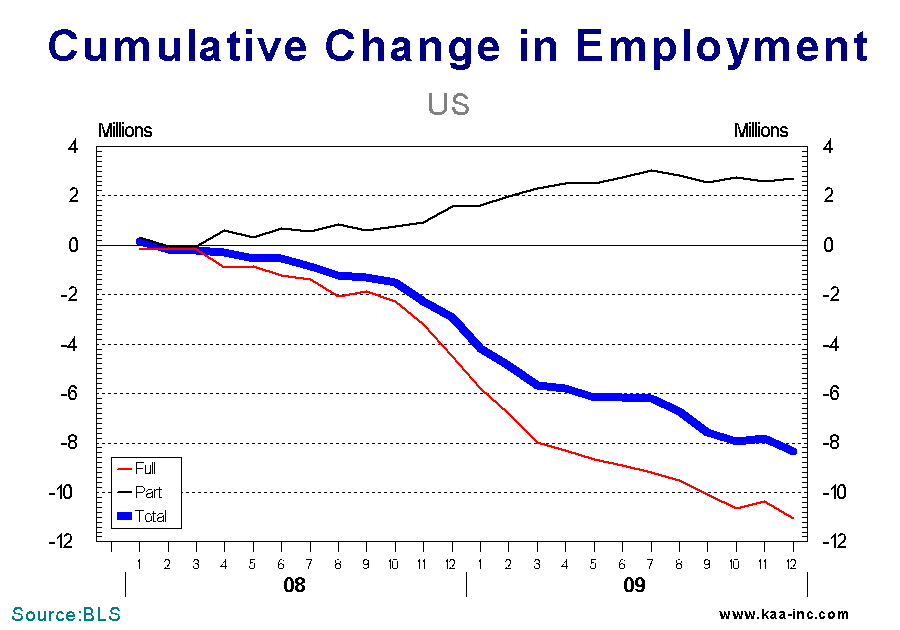
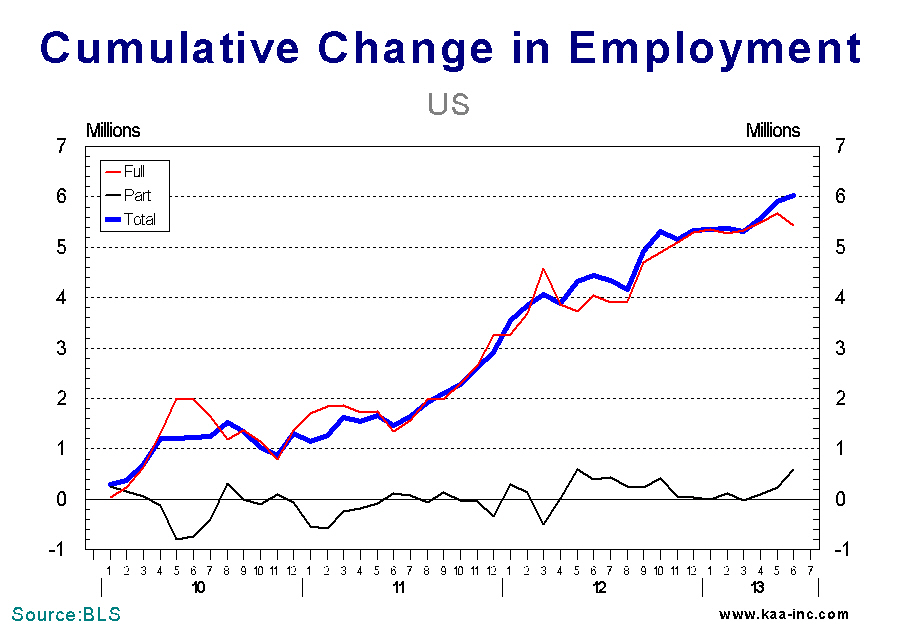
Close to 6 million jobs were created since the employment recovery started in 2010. There are always questions as to what percent of these jobs are part-time employment? And it we use January 2010 as the base, almost all of new jobs, except for half-a-million are full-time jobs. So, what is the answer? Are almost all of the new jobs full time? To answer this question correctly we have to look at the entire picture.
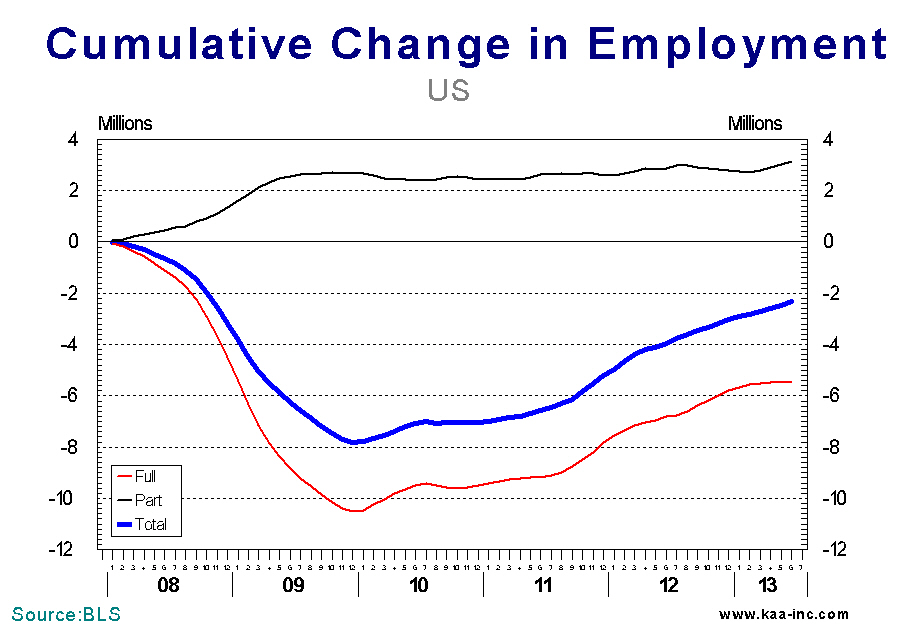
To do so we have to start with January 2008 when blood letting in the job market started. This period lasted through December 2009. During which 11 million full time jobs were lost. Part time jobs, however, moved in the opposite direction, more than 2.7 million part time jobs were created during this period. Clearly some full time jobs were replaced with part time employees. Thus the reported as 8.3 million clearly underestimates the financial devastation that was experienced by American work force.
The job recovery was almost entirely in full time jobs, and it has not been a continuos smooth process; close to 2 million full time jobs were created in the first half of 2010, then a million of them were lost in the second half of the same year. It took the full time job market until mid-2011 before it again showed 2 million jobs gained since the depth of the recession. The number of new jobs grew rapidly to 4 million by winter of 2012. Full time jobs are continuing to add up, however, at a decidedly slower growth rate since then, reaching 5.5 million new full time jobs by June 2013.
Part time jobs, which initially dropped as full time jobs rose, oscillated between half-a-million gain or loss since then.
Total job loss due to the Great Recession was recorded as close to 8 million jobs by the end of 2009. The job recovery has trimmed the total job loss by 6 million, reducing it to around 2 million jobs. During the same period, part time jobs recovered a gain of more 3 million new jobs, almost all of them during the period when full time jobs lost 11 million amongst their ranks.
The brunt of the recession was beared by the full time job holders. Despite the job recovery over the last three-and-a-half years only half of the full time jobs lost has been recovered.
Promised Neighborhoods, Lehigh Valley
The roll and impact of pre-K education on the community was discussed on Lehigh Valley Discourse, WDIY on July 18. To listen go to click on the following link.
http://www.wdiy.org/post/promise-neighborhood-lehigh-valley-discourse
About KAA – The Market Research Firm
KAA (http://kaa-inc.com) offers scientific multi-media market research and customer satisfaction studies. Operating since 1988, we have developed a systematic way of predicting and preventing customer flight and increasing our clients’ customer bases. Our Ph.D. led initiatives provide scientifically accurate and statistically significant results that turn customers into raving fans.
Lehigh Valley’s payroll employment registers well above pre-recession levels and rising
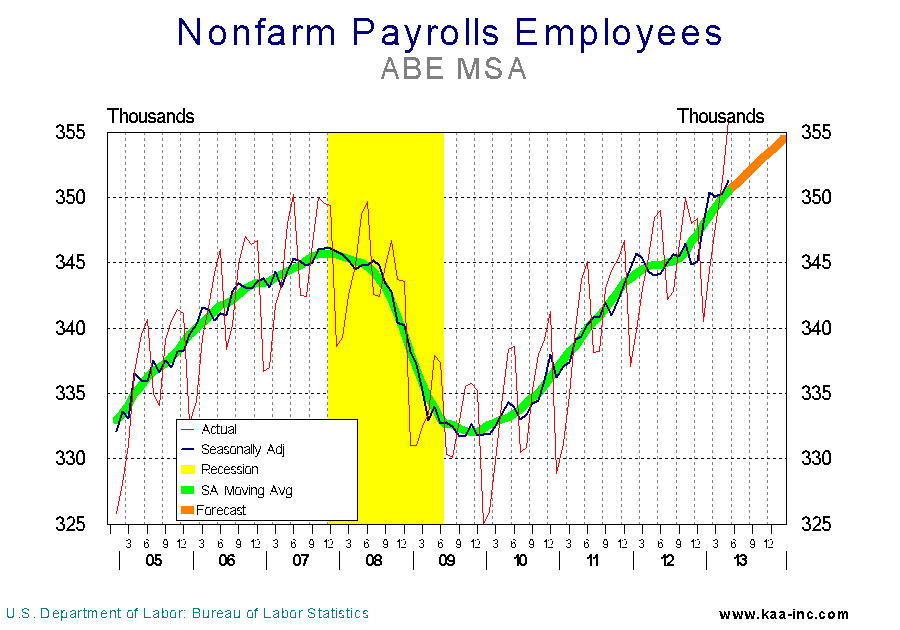
Payroll employment in the ABE MSA reached a high of 346,100 (seasonally adjusted) in December 2007. As the Great Recession took hold, payroll employment in the ABE area dropped to a low of 331,700; a loss of 14,400 jobs.
Although the Lehigh Valley lost more than fourteen thousand jobs, it fared better than the national average. Between January 2008 and February 2010, nationwide payroll employment dropped by 6.3 percent, however, in the ABE area it was just 4.2 percent; a little less painful.
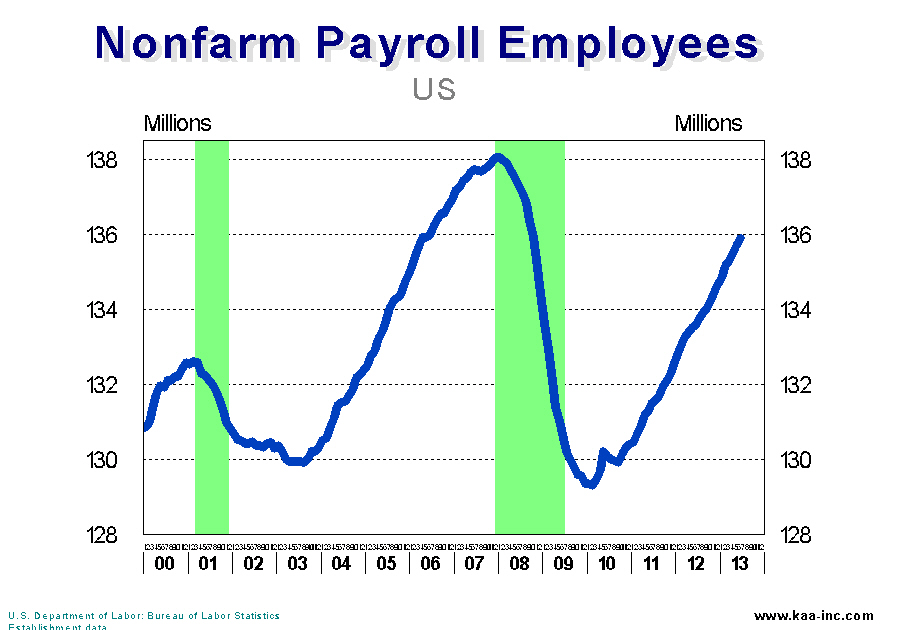
The 14,400 jobs that were lost in the region have been recovered, and as of May 2013 an additional 5,200 jobs have been added (a net gain of 1.6 percent). At the national level, 6.3 million jobs have been added (total gain of 4.9 percent), but still 2.4 million short of the high in January 2008. The ABE area, relative to the national average, lost fewer jobs during the Great Recession and has gained more jobs since the start of the recovery.
Why then doesn’t it feel like a recovery? The clear answer is that while the jobs created accounted for those that had been lost it didn’t take into consideration the influx of new graduates and others who were entering the labor force which boosted the total number of job seekers.
When we look at the math; the labor force expanded from 422,900 at the depth of the recession to 439,400 in May 2013, showing an increase of 16,500. To accommodate the 14,400 jobs lost during the Great Recession plus another 16,500 for newcomers to the job market; the creation of at least 30,900 jobs is required. The total gain in new payroll jobs was 19,600; an impressive number. However, when putting it into perspective it is still 11,300 jobs less than where we were in 2007 in terms of the unemployment rate.
A survey of local businesses shows that they are hiring and are planning to hire more people. Absent a major shock to the economy, we project that total employment in the ABE MSA will continue to grow at a better rate than the national average, at least for the balance of this year.
Drop in consumer expenditures and private investment lowered GDP growth
The 1st quarter GDP growth was revised downward from 2.5% to 1.8%. A big chunk of that was due to a downward revision in consumer expenditures from a robust growth of 3.2% to 2.6%. Consumers also appeared to have spent less on “services” than previously estimated, the growth in this category dropped from 3.1% to a relatively poultry 1.7%. The revised consumer expenditures growth of 2.6% is not bad, but it is clearly not robust.
Of more importance to future economic growth, was the significant downward revision of the growth of private domestic investment from 12.3% to 7.4%, while still a good number, it is far from the robust double digits of the original estimate.
There are other minor adjustments to the original estimate, but these two are of most impact and have caused downgrade revisions to most forecasts of 3% plus growth for 2013.
Is Bernanke daring you to buy stocks?
Radio interview with Chuck Jaffe on MoneyLife Radio.
130528 – Big Interview with Kamran Afshar
About KAA – The Market Research Firm
KAA (http://kaa-inc.com) offers scientific multi-media market research and customer satisfaction studies. Operating since 1988, we have developed a systematic way of predicting and preventing customer flight and increasing our clients’ customer bases. Our Ph.D. led initiatives provide scientifically accurate and statistically significant results that turn customers into raving fans.