


Author Archives: admin
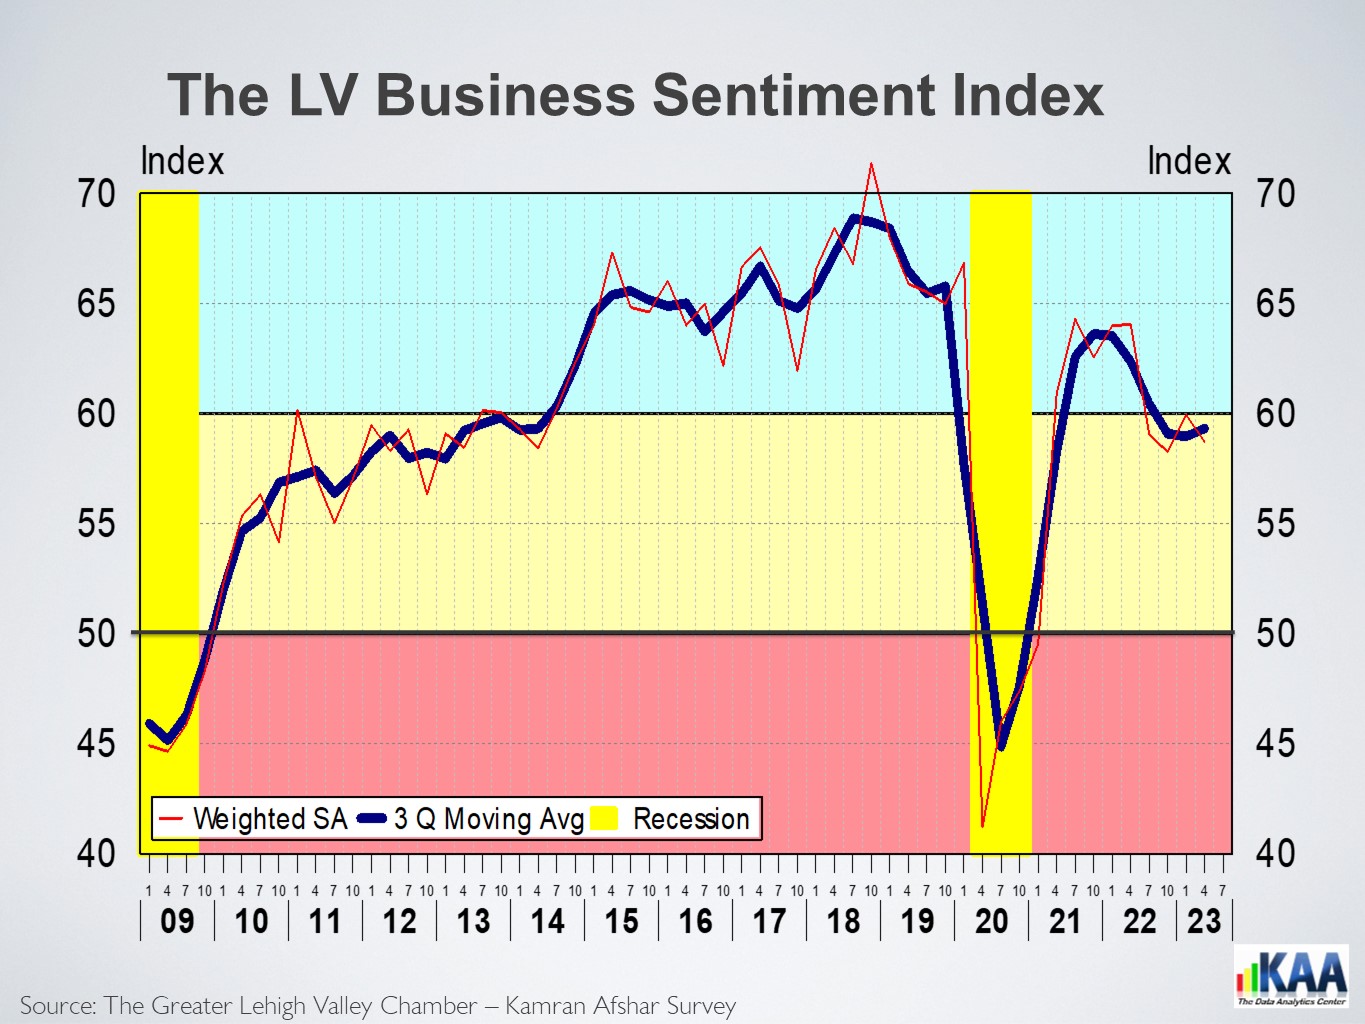
The Lehigh Valley business sentiment is on a down-trend

The Lehigh Valley’s Business Sentiment Index (BSI) experienced a sharp decline in 2022 as inflation surged. Although the pace of decline eased by late 2023 as inflation rates began to fall, the index remains on a downward trend. At 54, the BSI is down 5% for the year but still above 50, indicating that more businesses maintain a positive outlook than a negative one.
The BSI is based on a quarterly survey of businesses in the Valley conducted by the Greater Lehigh Valley Chamber of Commerce- Kamran Afshar since 1998.

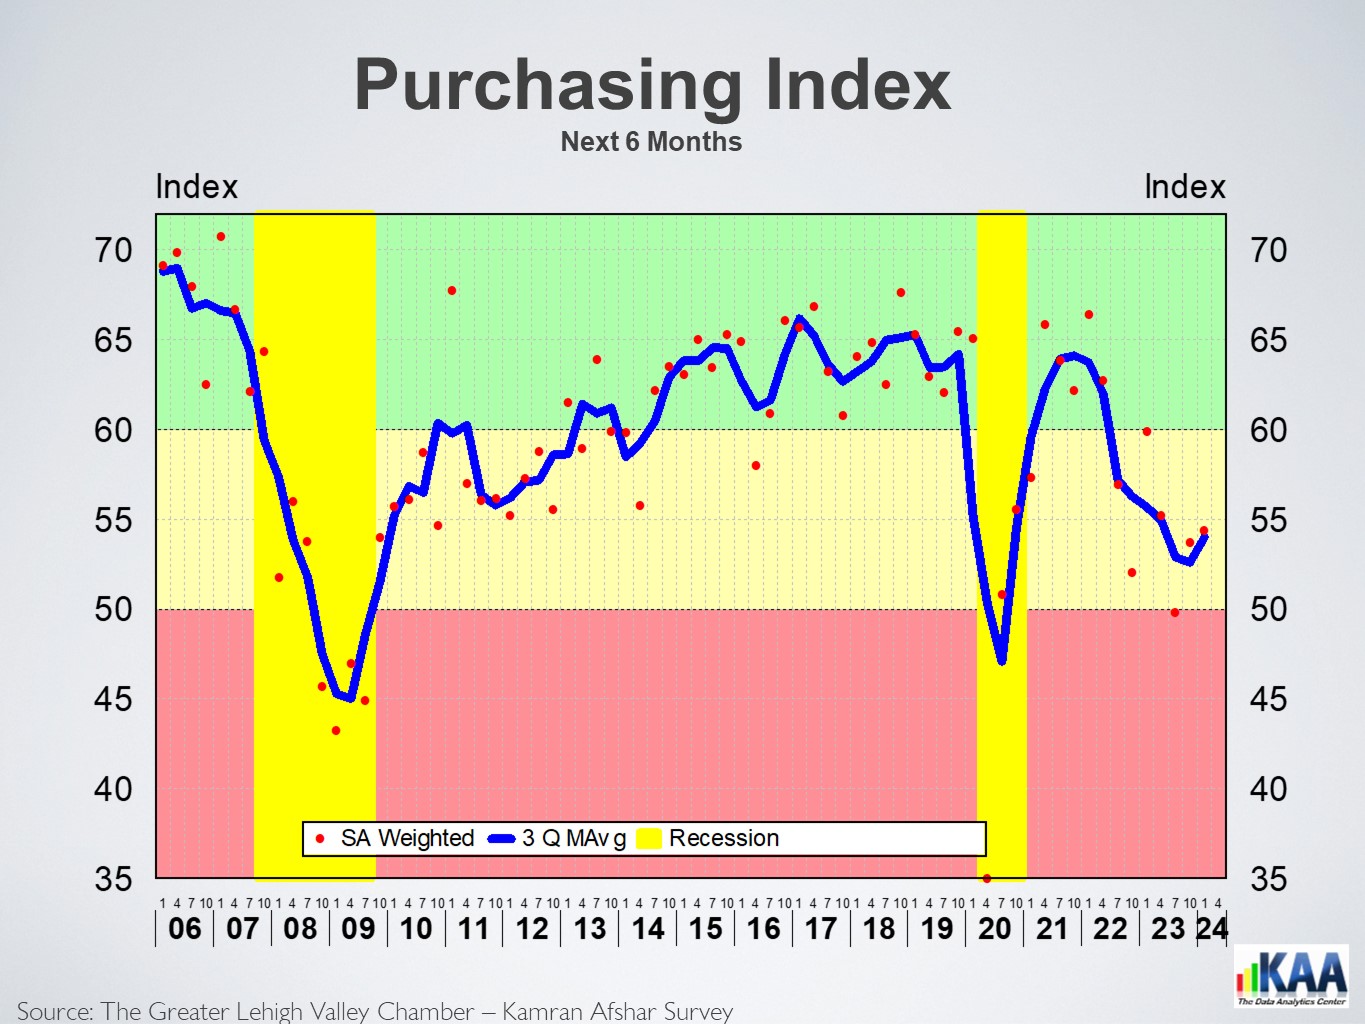
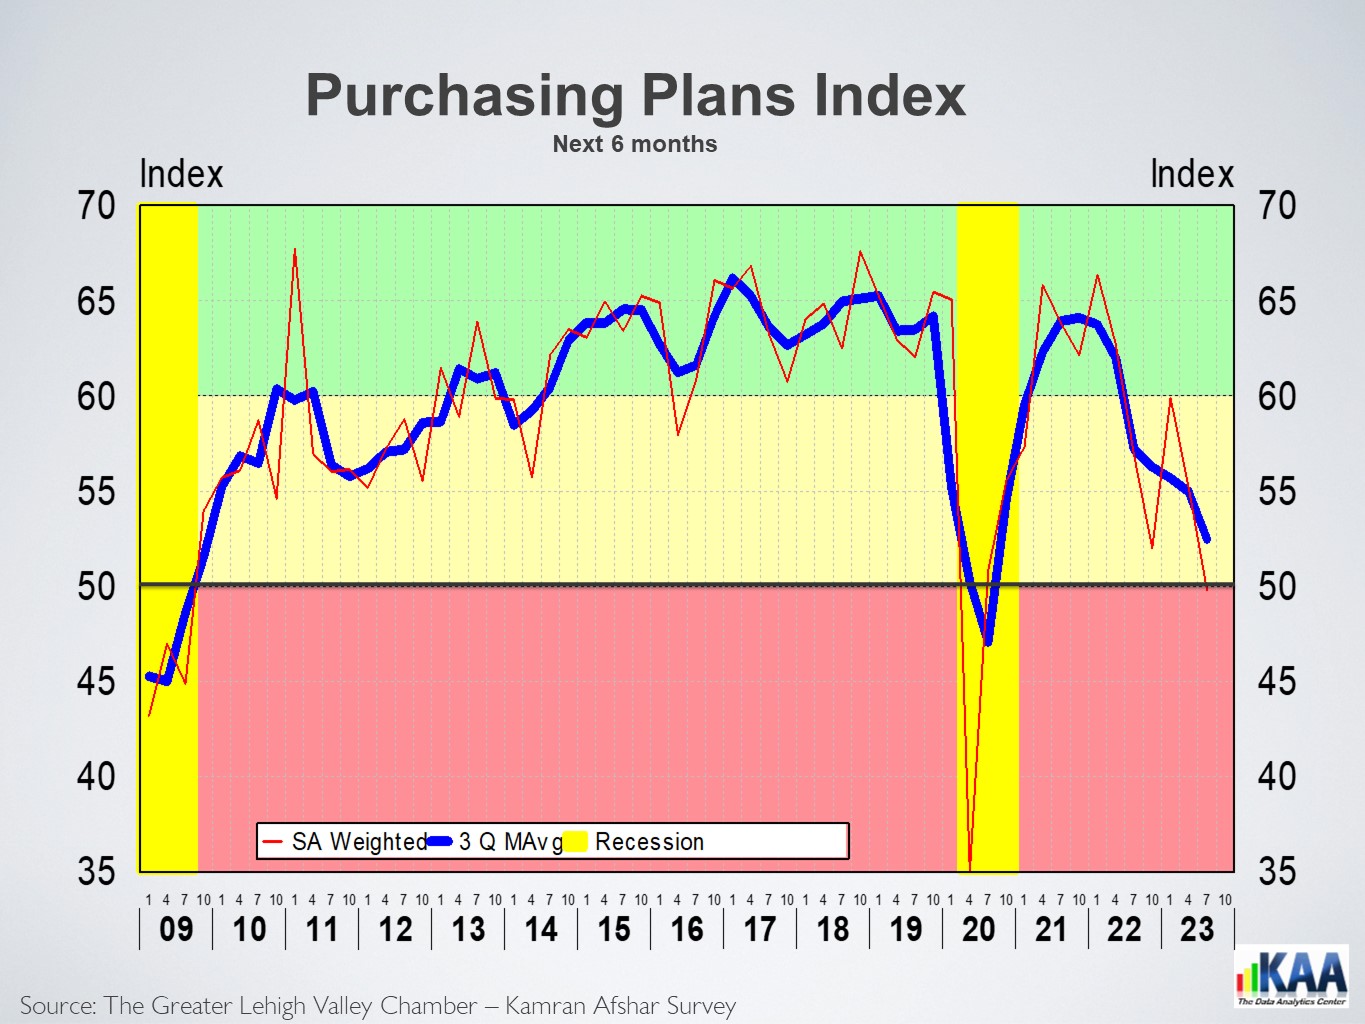
While in a long-term upward trend, the index of plans for future purchases fell to 51.4 in October, marking a significant 8% drop and erasing all gains made earlier in the year. At this level, it is now below its October 2023 position. Although a slightly higher percentage of local businesses intend to increase their purchases, the average planned increase has noticeably diminished.

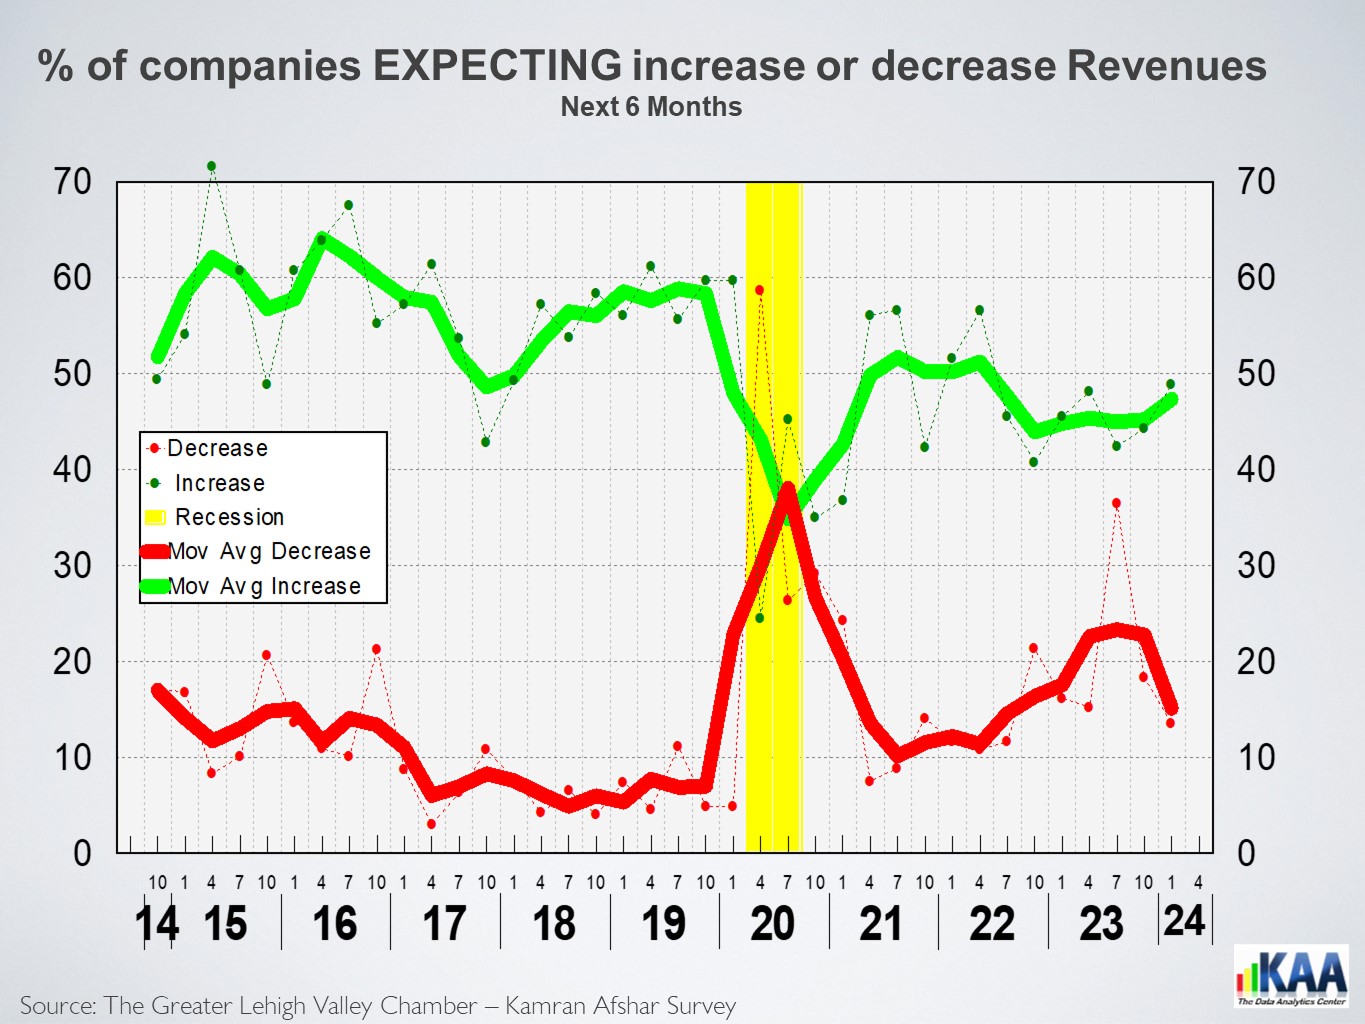
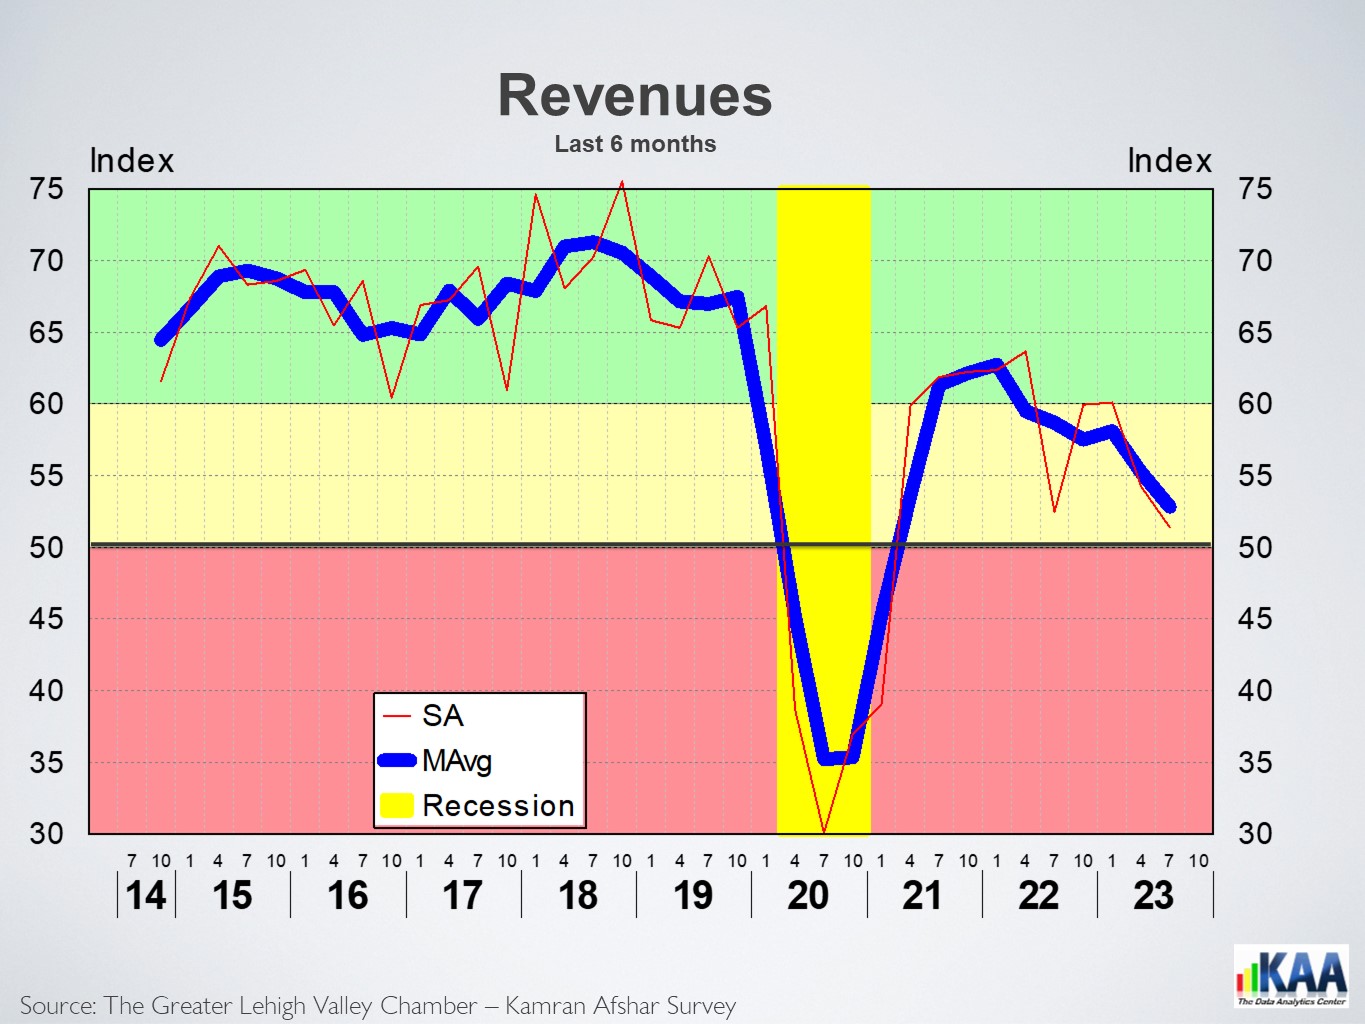
The index of past revenues, while 6% below its July level, is still up for the year. Thirty-three percent of the respondents reported higher revenues, while 29% saw their revenues shrink over the last 6 months. On average, however, revenues were down from their July level.

The index of past hiring is the only measure in our model to fall below 50 in October, indicating that more businesses laid off employees than hired over the past six months. At 47, this marks the second consecutive quarter the index has stayed below 50%. The percentage of local businesses that increased their employment has dropped to its lowest level in 4 years, while the percentage of those laying off employees rose to its highest level. This was reflected in total employment data, which showed a slight drop during the summer months.

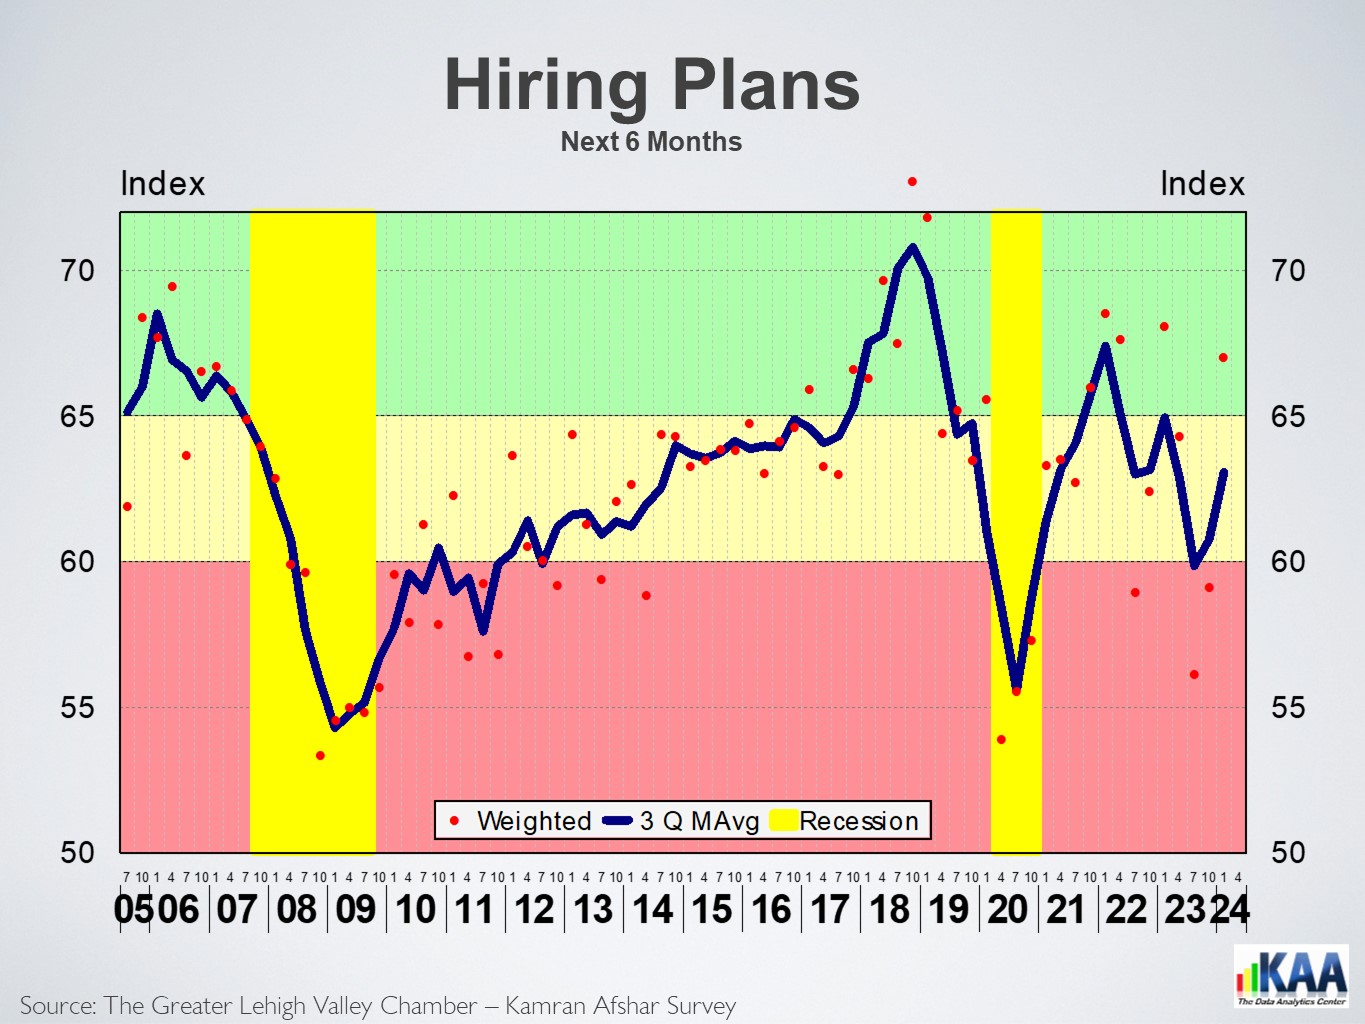
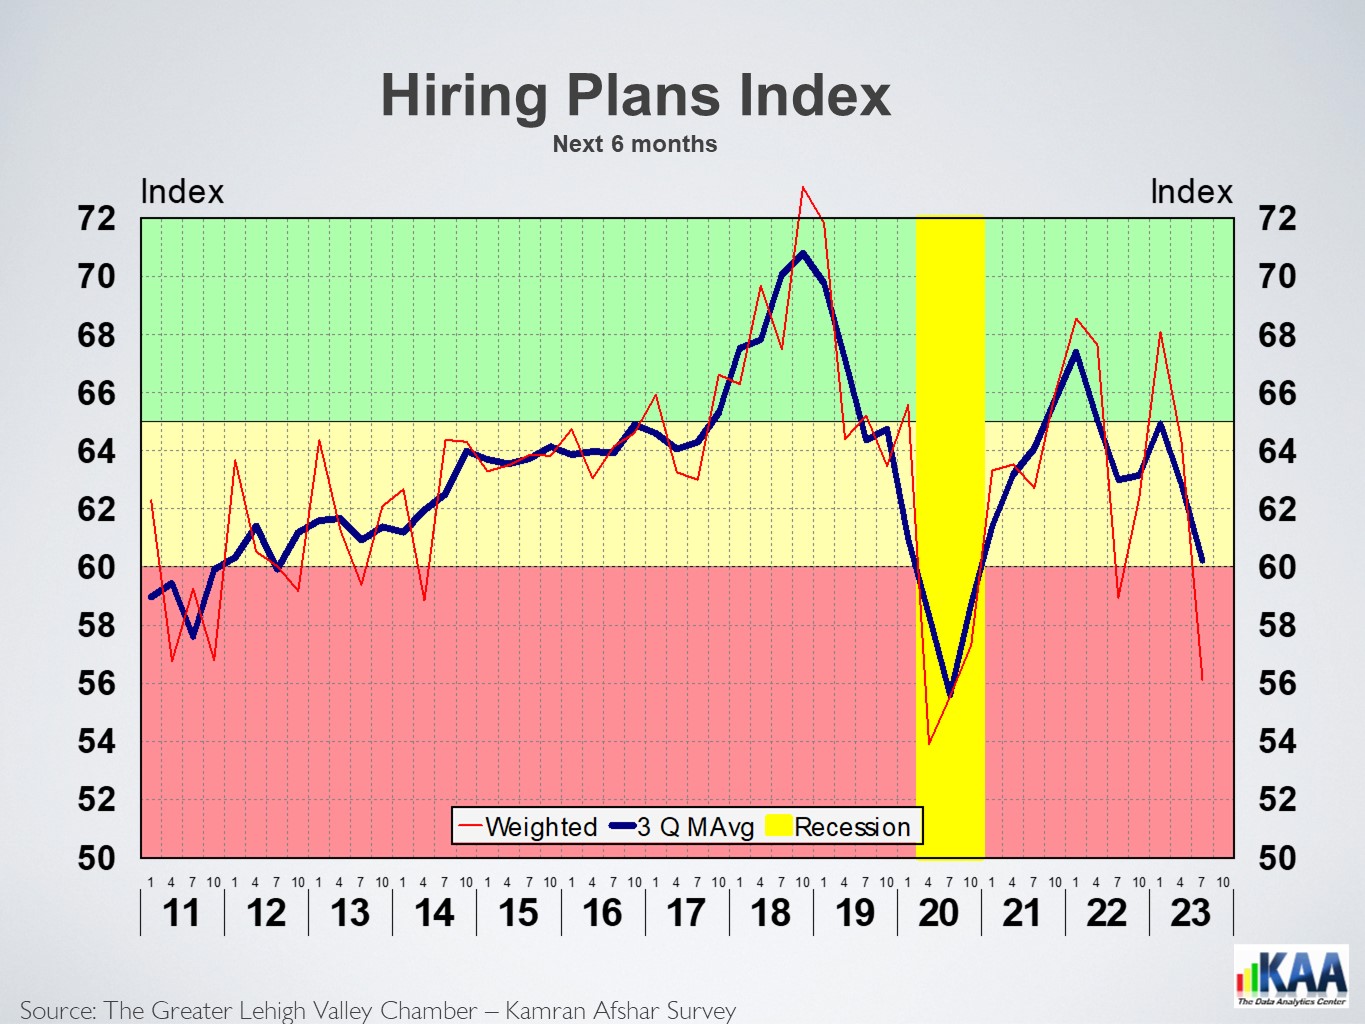
Plans for future hiring is the only index in our model that, while down for the year, rose in October, as the percentage of businesses planning to increase employment was more than twice that of those planning to reduce theirs.

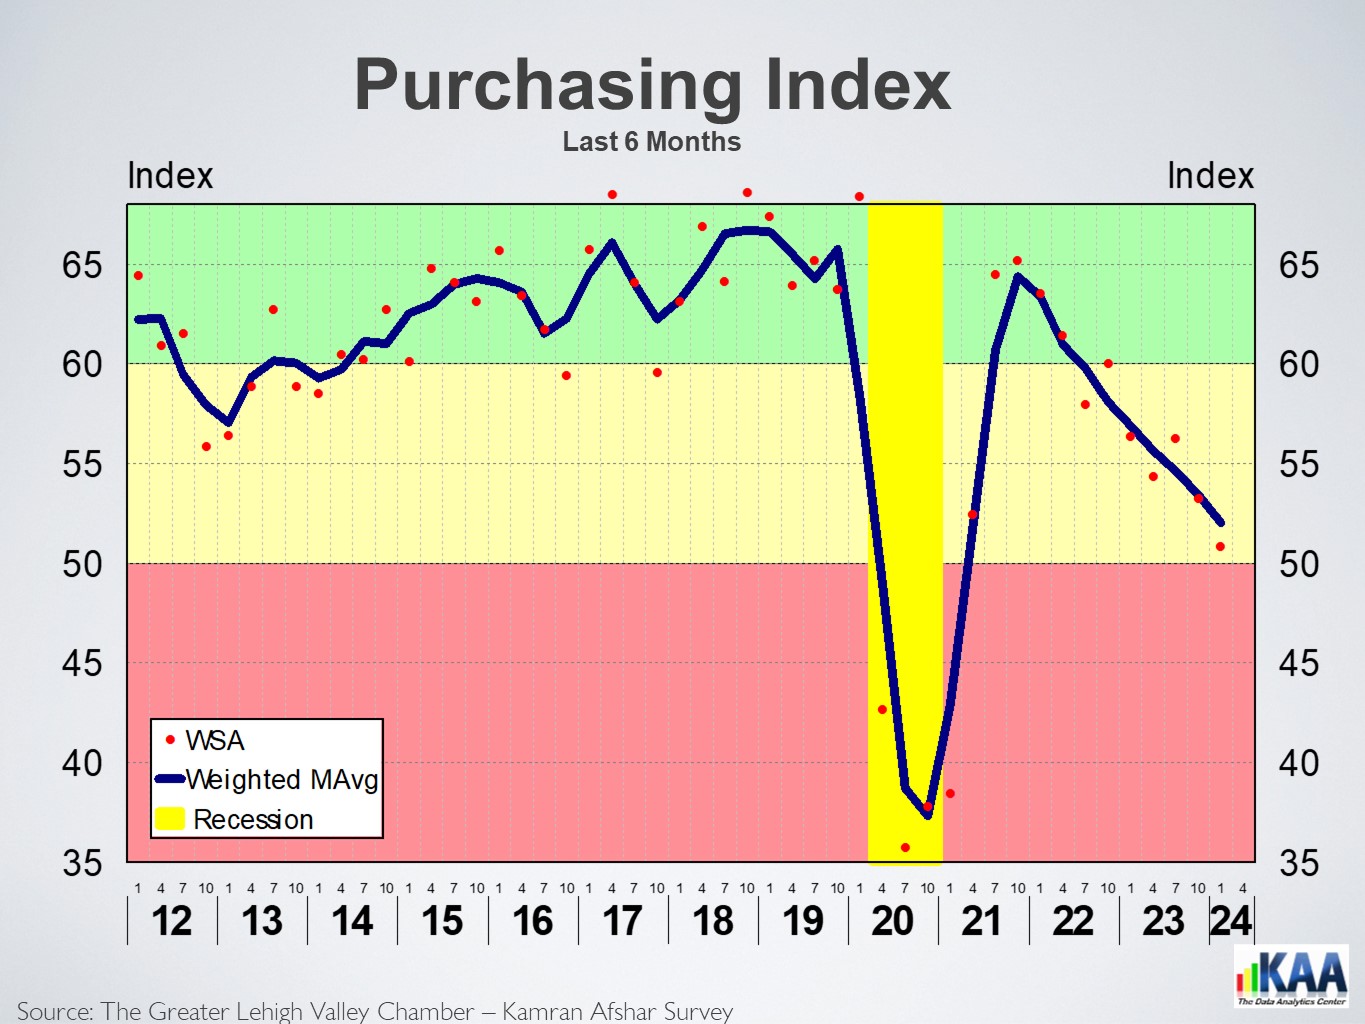
The index of purchases in the last six months has dropped for the second quarter in October, falling by 4% below the July level. While the percentage of businesses that increased their purchases was higher than those that reduced theirs, the average purchase amount has decreased.

The index of future revenues has been in a statistical tie for the last five quarters.
The overall index has been falling for the last two years. The 2022 high inflation also impacted businesses, as their cost of hiring and other inputs started to rise. Of the four sectional indices in our model, all began to decline in late 2021. Since the beginning of this year, the index of revenues is the only index that has been rising, while the hiring index has been at its lowest since the Covid recession. Businesses have reduced their hiring primarily due to lack of availability, as the number of unemployed in the Valley is at its lowest level for this century.
The forward-looking indices score significantly higher than those reporting events in the last six months, indicating businesses feel much more optimistic about the future than in the past.
The Lehigh Valley business sentiment Shows a slight improvement

The Lehigh Valley’s Business Sentiment Index (BSI) post-COVID peaked in July 2021 and dropped as inflation rose. As inflation started to subside, the index stopped falling, and since last July, the index is trending has slightly up. The BSI is based on a quarterly survey of businesses in the Valley conducted by the Greater Lehigh Valley Chamber of Commerce- Kamran Afshar since 1998.
While the index was statistically tied with its October and July levels, it was 5.5% below last January’s due to the drop in purchasing and past revenue indices. It is, however, significantly above its January 2023 level regarding the expectation of future revenues. The overall index stands at 56.6 for January 2024. We have benchmarked the index to year 2000 as 100; based on that, the January index is 82.5.
In comparison to last October, three of the six indices in our model were down, one was up, and the remaining two, while positive, were statistically ties to their October levels.
The index of past hiring fell 7.5% below its October level, which reflects the slowdown in hiring in the Valley. Information, healthcare, and construction led the hiring, while retail and accommodation-food led the layoffs. Most of the hiring was done by businesses with more than 100 employees, while the largest layoffs were those with 51 to 100 employees.
The index of past purchases dropped 5% in January. Manufacturing and finance led the reductions, while transportation-warehousing and construction sectors led the increases.
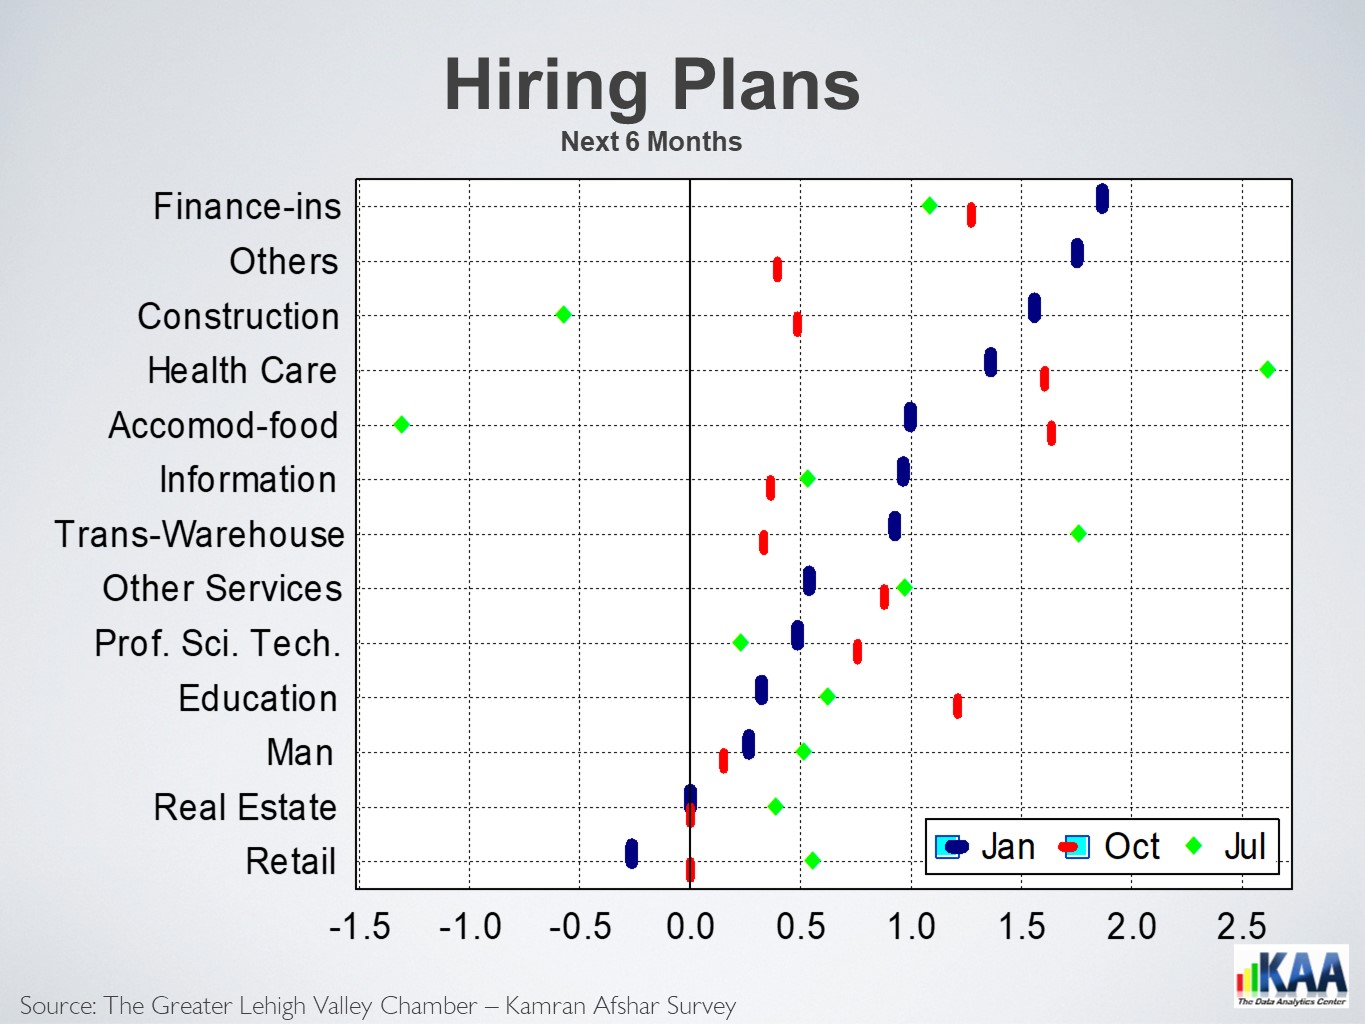
While the index of plans for future purchases rose in January, the increase was not statistically significant. Education, finance, and transportation-warehousing sectors led the plans to increase expenditures, while real estate and retail led those planning to reduce expenditures in the next six months.
The index of past revenues registered the largest drop, falling 10% in January. Half of the business categories in our model, led by real estate and accommodation-food, reported declining revenues over the last six months. Finance and transportation-warehousing led the other half, which reported rising revenues.
While the expected future revenues’ index increase is not significantly higher than its October level, it is 4.5% higher than its January 2023 level. Education, construction, and healthcare led most of the business categories in our model, expecting higher revenues in the next six months. Retail and manufacturing were among the few who expected declining revenues.
The Lehigh Valley business sentiment index trended down from the middle of 2022 to July 2023; it has since reversed direction. A large part of this is due to reduction in labor market churn, as businesses reported significant decreases in both hiring and layoffs. Also, regarding future expectations, there has been an increase in the percentage of respondents anticipating higher revenues, coupled with a significant decrease in those expecting lower revenues. The Data shows that despite the drop in the assessment of the current economic conditions, expectations of the economy’s future have been rising since last summer. This is a positive indicator for the Valley’s economic outlook over the next six months.

The Lehigh Valley business sentiment index has been dropping since mid-2022
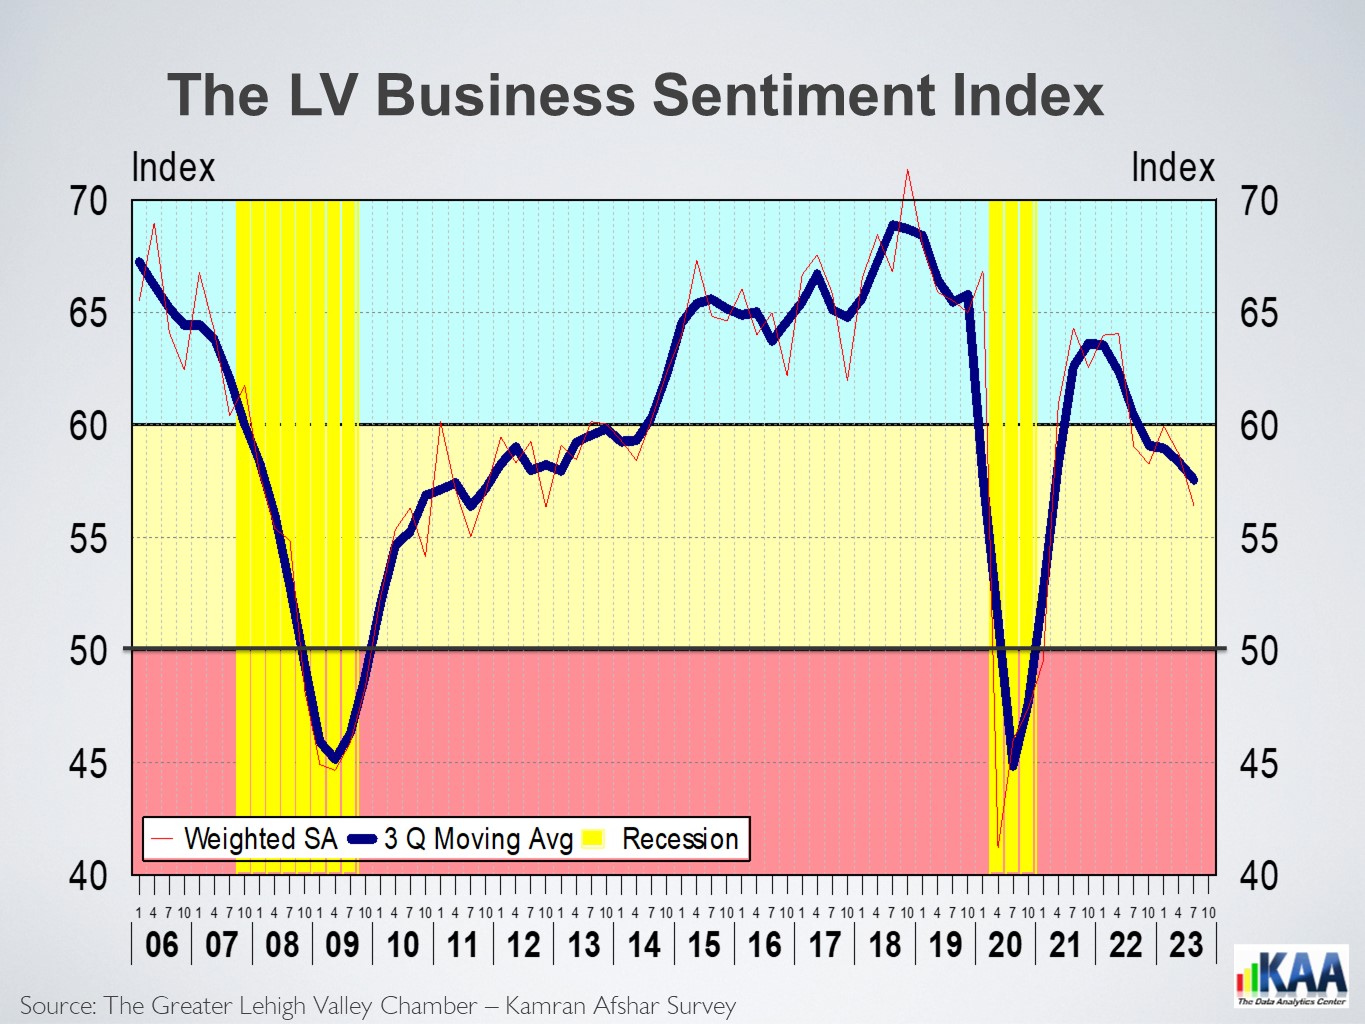
The Lehigh Valley’s Business Sentiment Index (the BSI) peaked in July 2021 at 64, then went sideways through April 2022. As inflation started to skyrocket, the index began to drop. The overall index for July at 56, is 4% below April of this year and 5% below its July 2022 level.
The BSI is based on the quarterly survey of businesses in the Valley conducted by the Greater Lehigh Valley Chamber of Commerce- Kamran Afshar since 1998.
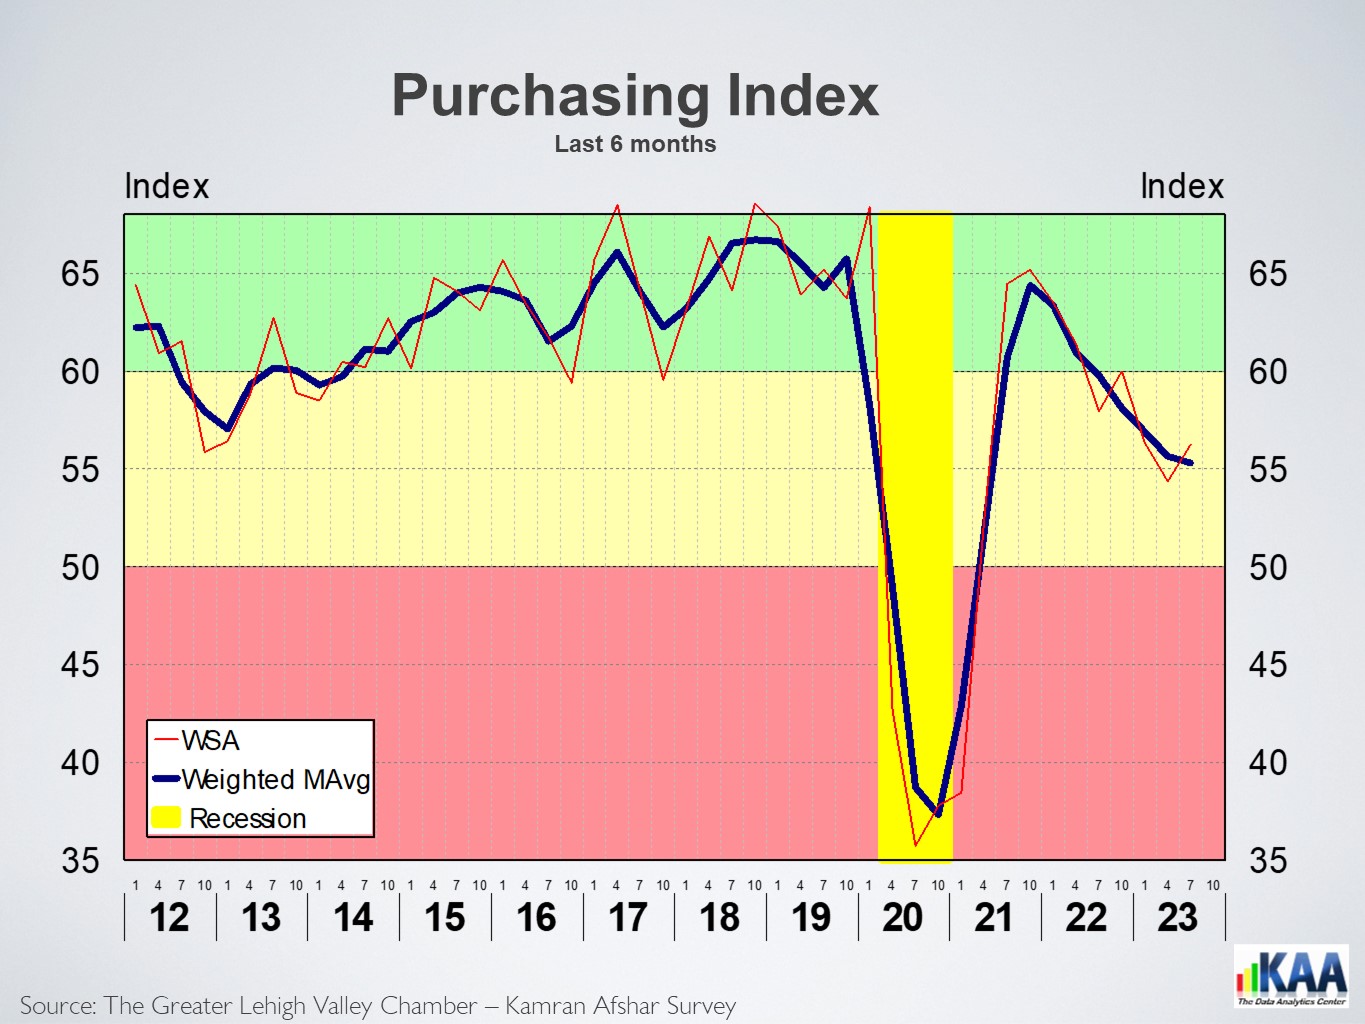
The only component of the index which recorded a measurable increase is the index of past purchases, which rose by 4% in July. Real estate and healthcare led the increases, while manufacturing and construction led the declines.

The index of expected future revenues showed a slight increase. Healthcare, finance, and manufacturing led those expecting larger increases in their revenues over the next 6 months, while construction and accommodation-food sectors expected future reductions in their revenues.
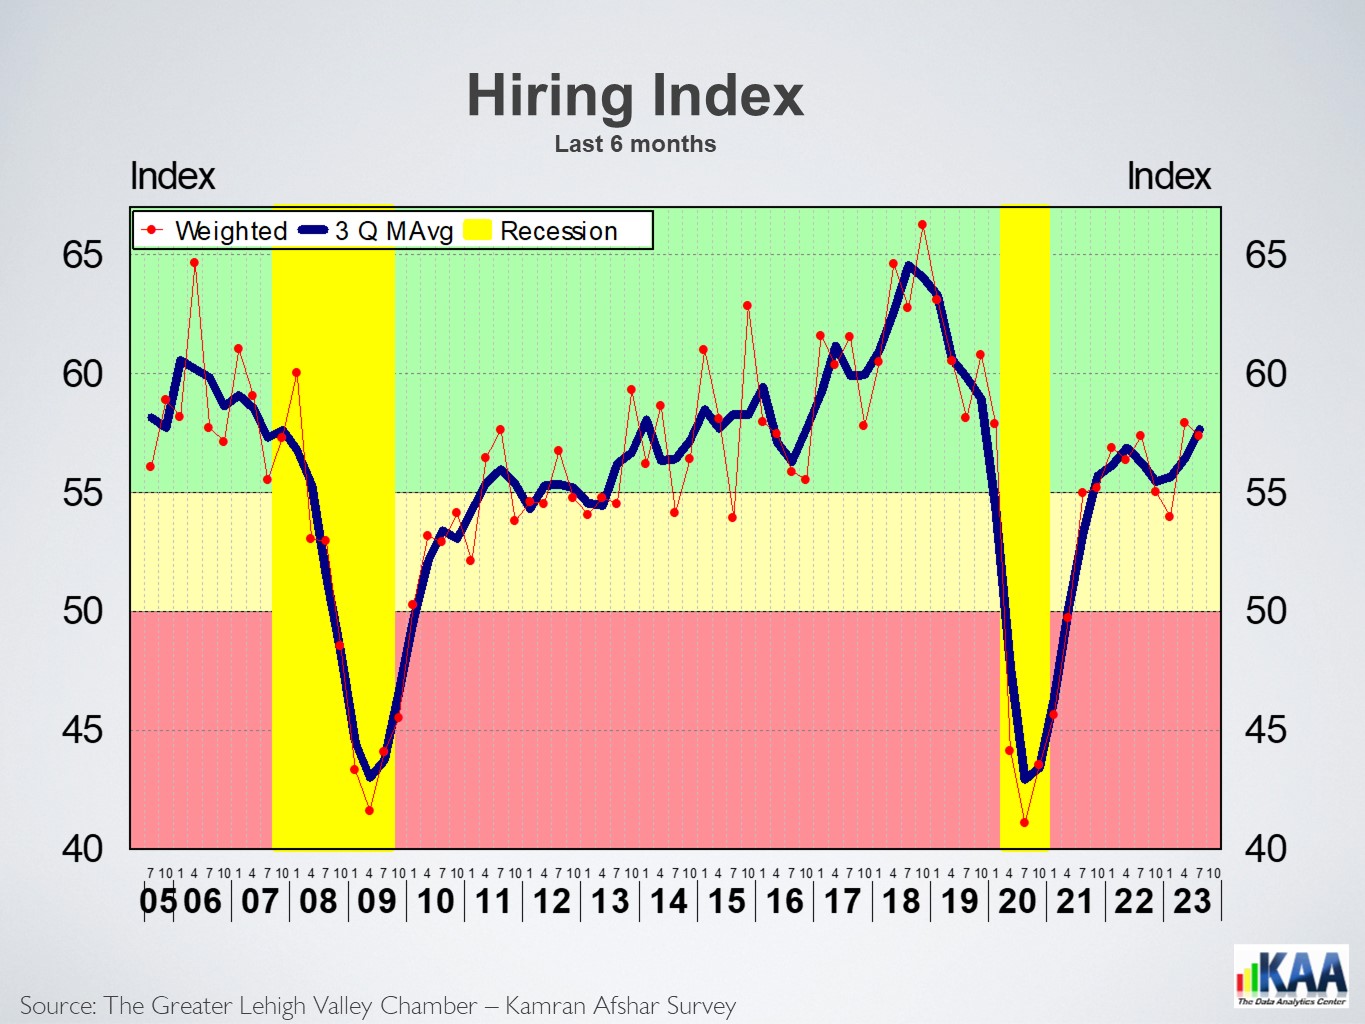
In July, the index of past hiring is in a statistical tie with its April level and at the same level as in July 2022. As reflected in the 7,500 new local payroll jobs created in the last 12 months in the Valley. However, local employment growth is slowing down, as in July 2022, this number was twice as large. One of the reasons for the slowdown in hiring is, availability. Healthcare and finance led the sectors with the highest hiring levels, while Transportation-warehousing and manufacturing had the layoffs.
The largest drop in July was in the index of plans for future hiring, which dropped by a significant 13% below April’s level. This index, at 56, is at its lowest level since July 2020, when COVID was still raging. Many employers have reduced their future hiring plans due to lack of success in meeting their current hiring goals.
The index for plans for future purchases dropped by 10% in July, falling to 50, its lowest level ever during normal times. The last three occasions this index was this low were during the COVID recession in 2020 and the Great Recession in 2009 and the 2001 recession.
The index for revenues over the last 6 months dropped by 5% in July. Manufacturing and construction sectors reported the largest revenue drops, while healthcare and retail sectors led the revenue gainers.
The July drop in the Valley’s business sentiment is the 4th drop in the index over the last 5 quarters. The customer sentiment index was also dropping before reversing course in June, so we expect the Valley’s BSI to also start to improve. Something that we will find out after the October survey.
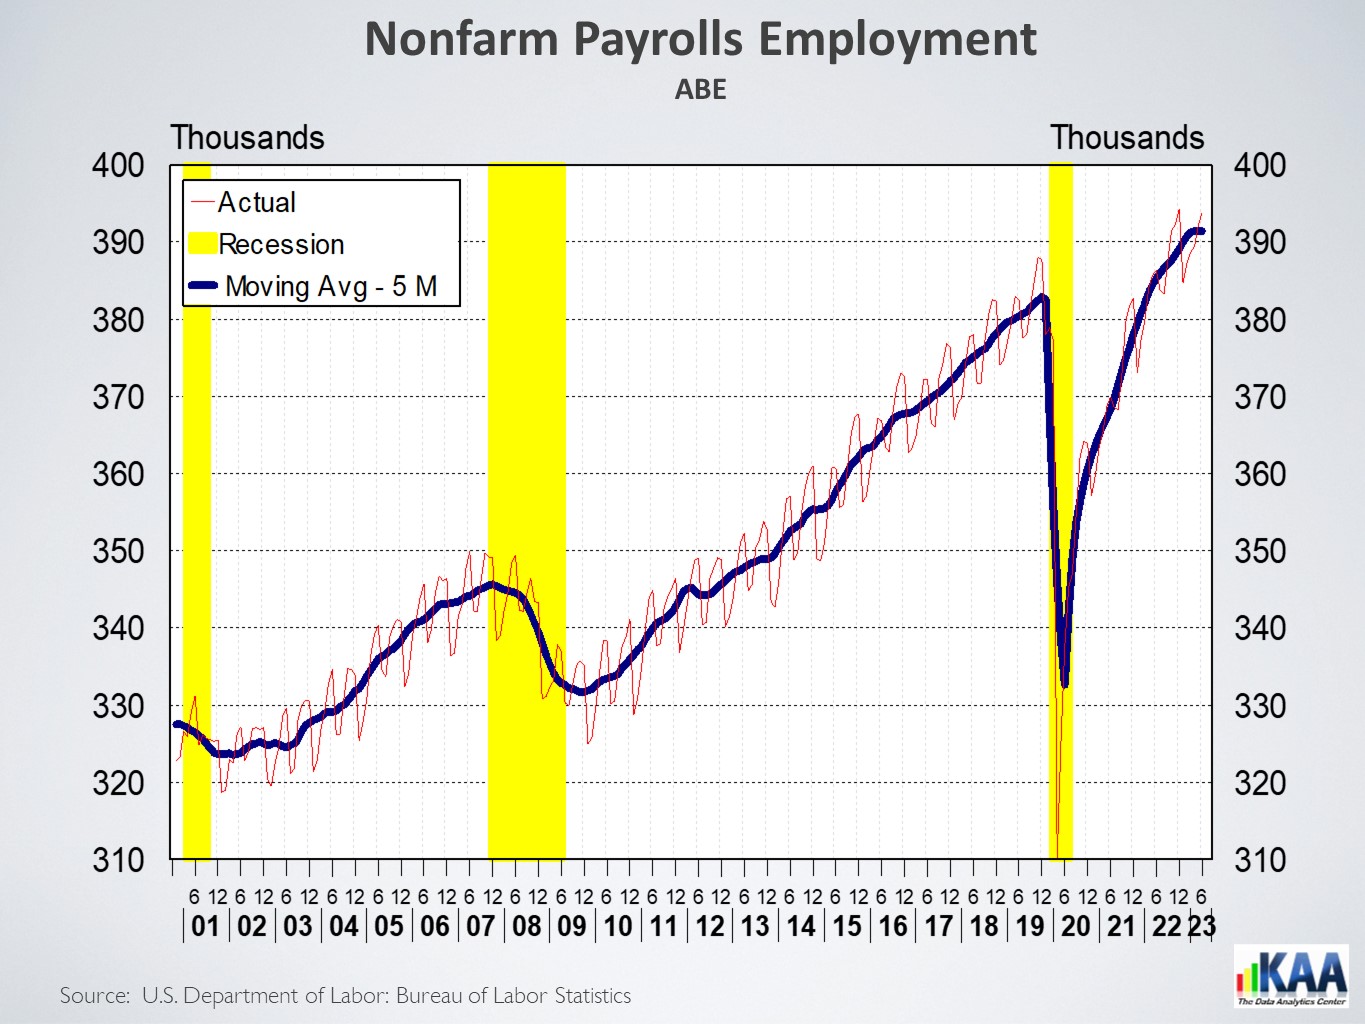
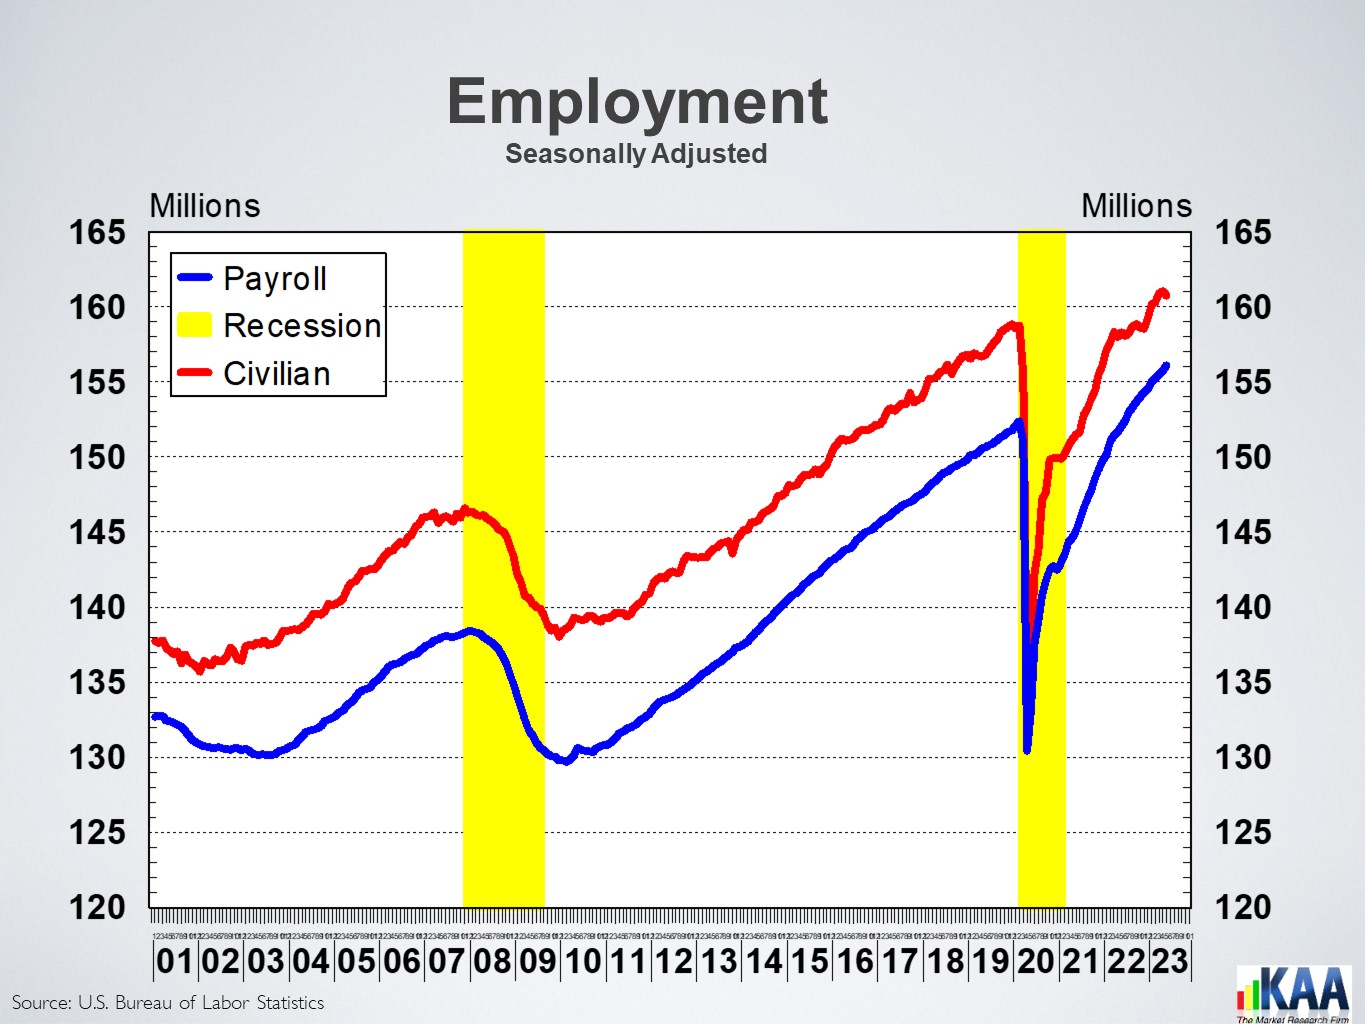
Payroll employment rose by 339,000 in May
According to the Bureau of Labor Statistics, payroll employment rose by 339,000 in May, significantly larger than expected 190,000, making the total number of jobs added in the previous 12 months 4.1 million. However, despite this larger than expected increase in payroll jobs, the unemployment rate rose to 3.7%, a large 0.3% increase.
To read more click on the following link:
https://kadac.net/posts/newsletter/202106171906-payroll-employment-rose-by-339-000-in-may
To listen to the podcast, click on the following:
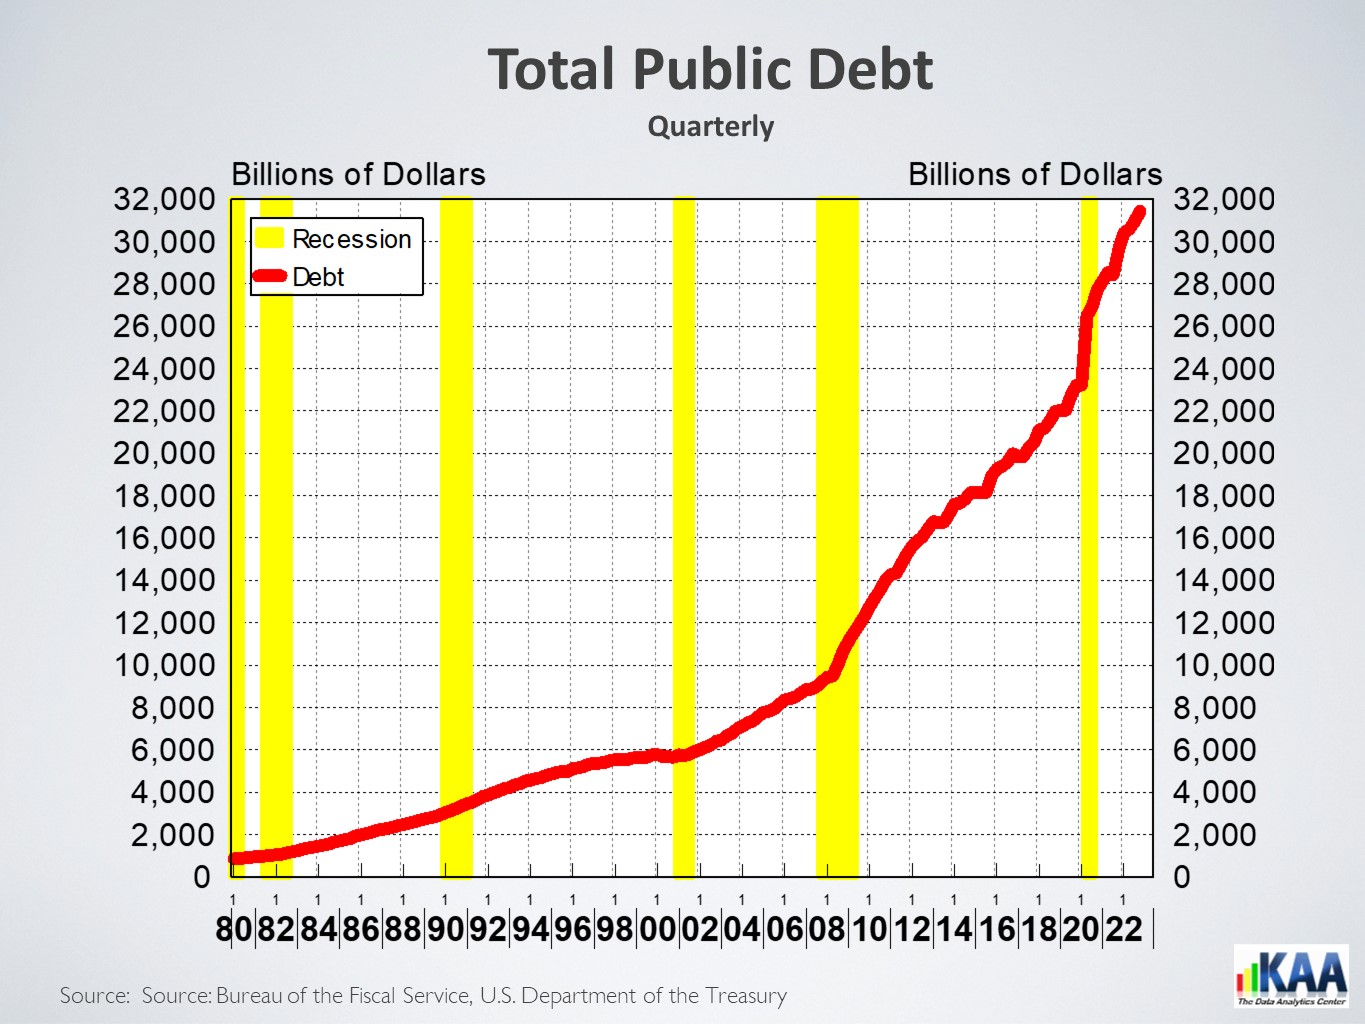
Our national debt is now larger than our GDP, is it possible to reduce the debt
The national debt is now at $31 trillion and will continue to rise. At this level, it is 119% of the country’s Gross Domestic Product. Yes, the national debt is larger than the GDP, and it has been since 2015. However, as high as the debt is, it is not the first time that debt has exceeded the GDP; at WWII’s end, the debt stood at 121% of the GDP. And much closer to the present, during the 2nd quarter of 2020, national debt rose to 135% of the GDP, even higher than after WWII.
The interest payment on the WWII debt was less than 1.8% of the GDP, which is obviously due to the very low interest rates of the time.
To read more click on the following link:
To listen to the podcast, click on the following:
The Lehigh Valley business sentiment index trending flat
The Lehigh Valley’s Business Sentiment Index, the BSI, has been moving between 58 and 60 since last October, and it stood at 59 in April, a statistical tie with its last three quarters. However, it is important to note that the index is 8% below its April 2022 level.
To read more click on the following link:
To listen to the podcast, click on the following:
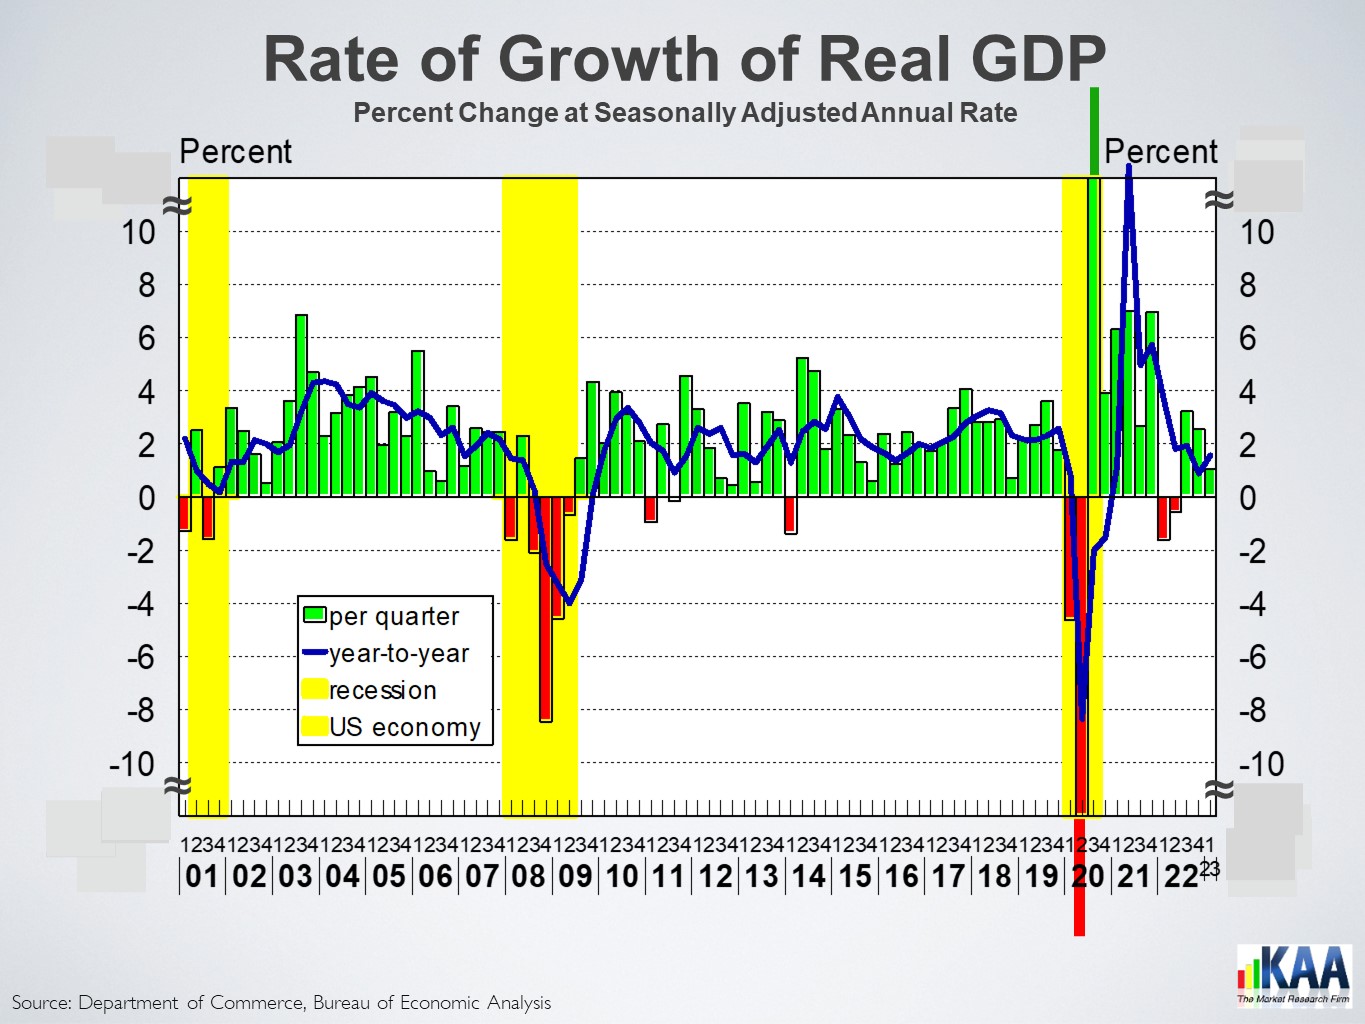
The economy grew by 1.1% in the 1st quarter of 2023
According to the Bureau of Economic Analysis, the advanced estimate of the US economy’s 1st quarter growth was 1.1% at annual rates. The highly regarded Weekly Economic Index estimate of 1.1% was on the money, while the Atlanta FED’s prediction of 2.5% was well above the observed rate. The economy grew by 2.1% in 2022, after an extraordinarily high growth rate of 5.9% in 2021, resulting from the economic engineering of a huge money transfer to individuals. And initially, there were many concerns about whether people will spend the money or not. The transferred money drilled a hole in our pockets and was spent rapidly. But then we developed a taste for that level of expenditure, so we drained our savings by almost a trillion dollars and then added another trillion dollars to household debt to continue our splurge. Last year was the party’s aftermath, and we had to clean up. The most obvious consequence of that level of expenditures was the 9%+ inflation we experienced last June and higher interest rates as the FED started to apply its breaks.
To read more click on the following link:
The GDP rose by 1.1% in the 1st quarter of 2023 – Newsletter – Kamran Afshar Associates Inc. (kadac.net)
To listen to the podcast, click on the following link:
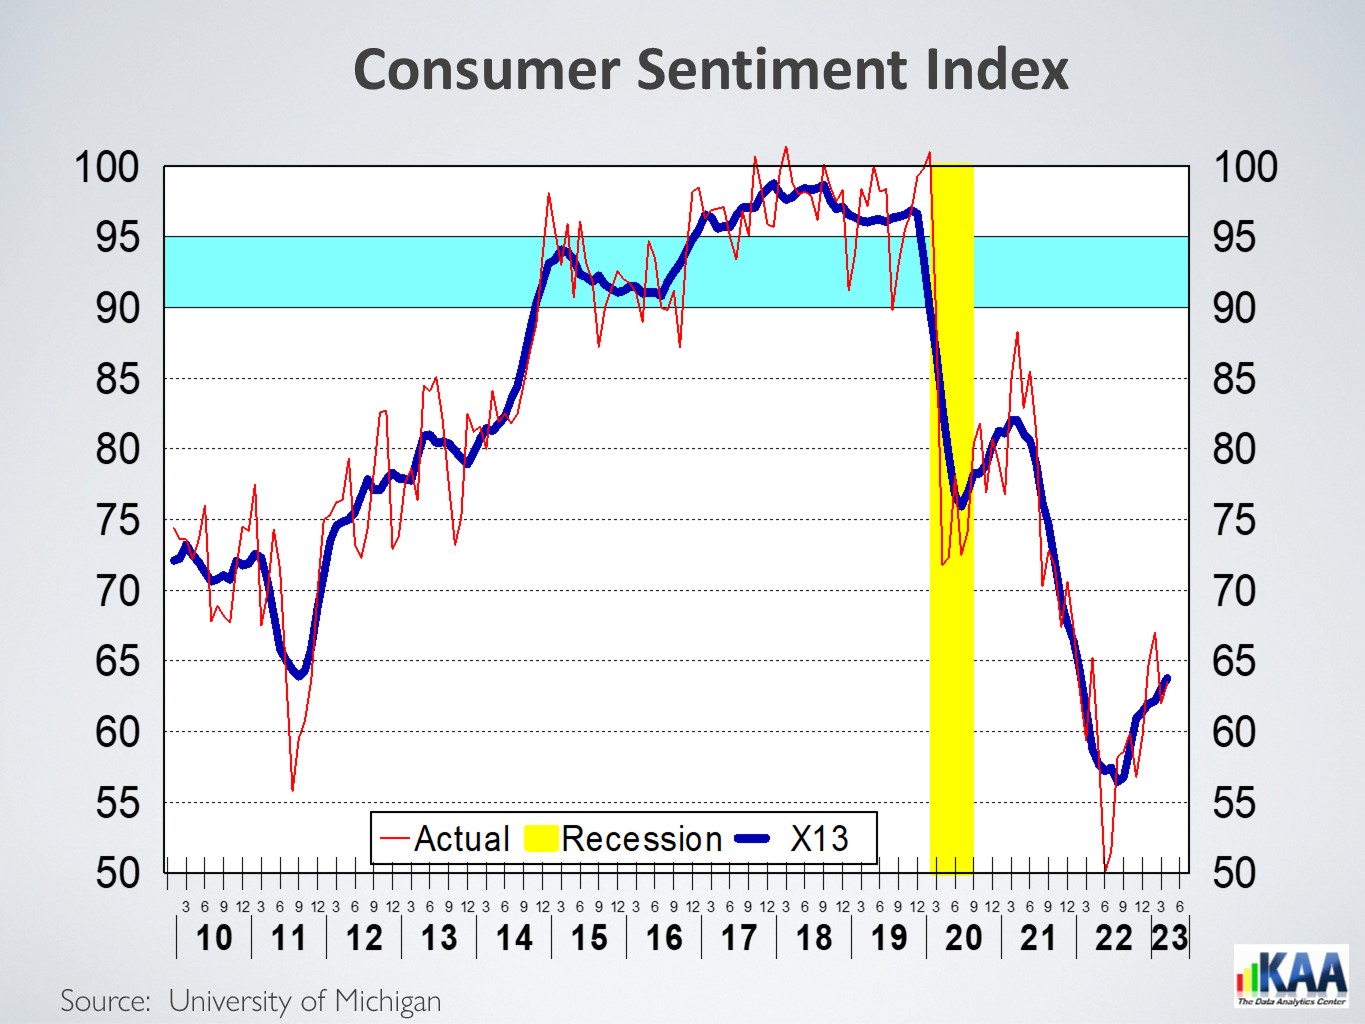
Consumer sentiment index is trending up
The consumer sentiment index, the CSI, which fell into its lowest level ever in June of last year, has been trending upward according to preliminary data for April, with the index’s moving average currently at 9% above its previous year’s level, as reported by the University of Michigan.
To read more click on the following link:
Consumer sentiment index is trending up – Newsletter – Kamran Afshar Associates Inc. (kadac.net)To listen to the podcast, click on the following link:
Economic Pulse: Week of 4/21/23 (wdiy.org)
Economic Pulse
Fridays at 5:44 pm, Mondays at 7:30 am on WDIY at 88.1
Hosted by Kamran Afshar
Dr. Kamran Afshar presents a synopsis of the week’s economic news with a detailed look at trends in the Lehigh Valley and the nation. Listen to Economic Pulse Fridays at 5:44 PM during All Things Considered, and Mondays at 7:30 AM during Morning Edition.
Is Inflation really back?
The consumer price index (CPI), rose by 0.8%in April. A level not seen since 2008. Calculating this at annual rates, that is, if this rate continues for a year inflation for that year will be 9.2%! A year not withstanding, even if this 0.8% increase in the CPI was just a one month event, it would have been a cause for concern; coming on the heels of another 3 exceptionally high rates during the first quarters makes it an issue. Inflation at annual rate calculates at 6.0% during the first 4 months of this year and 4.2% over the last 12 months. This is also the largest 12-month increase since September of 2008.