


Author Archives: admin
Residential construction waking up from slumber
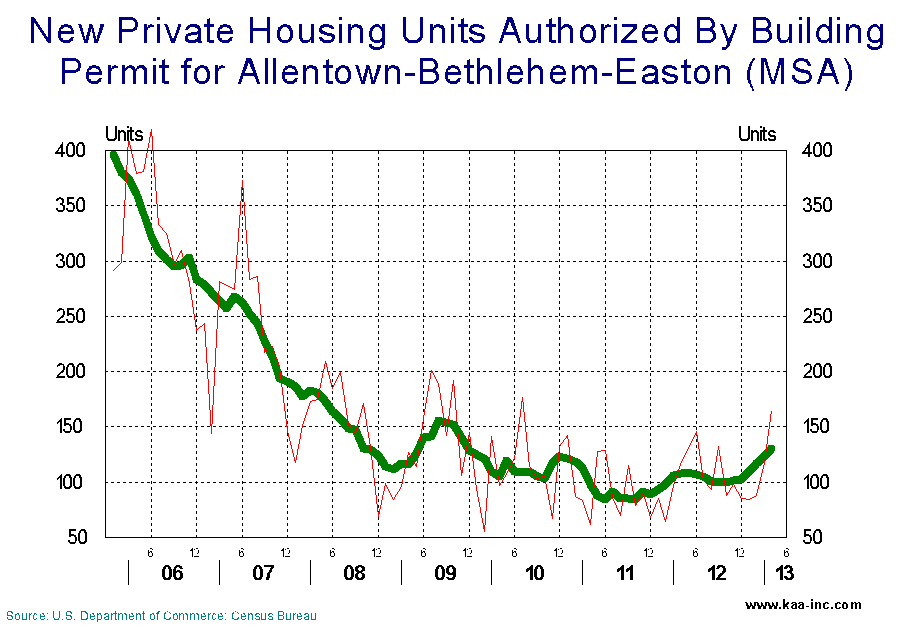
In April 2013 there were 148 (SA) building permits issued for new private housing units in the Allentown-Bethlehem-Easton MSA, which includes Warren, Carbon, Lehigh and Northampton counties. Raising the total number of permits issued in the last 12 months to 1,328. This is 17.5% higher than last April’s level, which is not a huge increase but a positive move in the right direction, keeping in mind that in March 2006 that number was 4,798. permits
Housing starts also followed a similar pattern in the region, it dropped from a high of 4,470 annual starts in 2006, to a low of 942 starts in 2012. This number has improved to 1,065 as of April 2013, an increase of 14.9%.
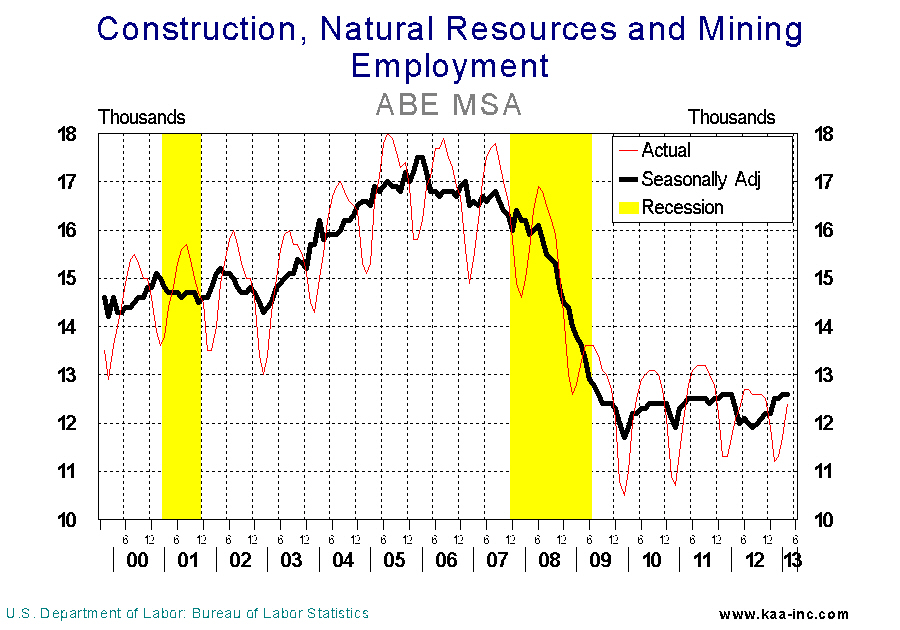
The drop in construction correlates directly with the 42% drop in employment in construction industry between 2005 and 2010. Local construction employment has shown a slight improvement since 2010. While total employment in the region has already exceeded its pre-recessionary level, we are nowhere near recapturing the previous peak employment level in construction. Clearly, construction employment significantly lags the rest of the region.
When all transactions are considered, housing price index has dropped 20% in the ABE MSA from the peak of the housing market, according to the Federal Housing Authority (FHA). The FHA’s price index includes all transactions based on sales price and appraisal data. While housing sales prices in Lehigh and Northampton counties are showing some improvement, the increases are relatively tamed.
Construction employment in the region will continue to improve for the balance of this year with the expectation that it will accelerate in 2014. Reaching the peak level of 2005, realistically, doesn’t appear to be in the cards any time soon.
“Do It Yourself” Market Research Web Tools Lack Scientific Oversight, Says KAA President
Market research firm is beta testing new product to help small and mid sized businesses get accurate analysis
Philadelphia, PA – Is your market research steering you in the wrong direction? KAA believes that many small to mid sized companies are being led to failure by their own market research. KAA faults the lack of scientific oversight of market research being conducted through “do it yourself” web tools. The tools are low cost and easy to implement but KAA believes that many of them are leading executives to make poor decisions.
Commenting on web based market research, Kamran Afshar, Ph.D., President of KAA stated: “Automated market research tools are helpful to big companies that have in-house research departments with trained professionals overseeing the initiatives. The problem is that many small to mid sized companies that don’t have research personnel believe that anyone can conduct accurate research. They are producing insights that aren’t scientifically accurate or statistically significant. Why? Because they disregard the science of market research, and understate the importance of unbiased questions, participant selection, and data analysis.”
KAA is beta testing a market research product that addresses the problem. The KAA Survey Engine offers automated features that are similar to those of their competition. The differentiator is that all client initiatives are overseen by KAA Ph.D.s. They write and / or proof survey questions, assist in participant selection, aid in implementation, and analyze results. KAA also affords their client’s the ability to deploy their surveys via web, smart devices, and / or traditional channels.
For additional information, please visit http://kaa-inc.com.
About KAA – The Market Research Firm
KAA (http://kaa-inc.com) offers scientific multi-media market research and customer satisfaction studies. Operating since 1988, we have developed a systematic way of predicting and preventing customer flight and increasing our clients’ customer bases. Our Ph.D. led initiatives provide scientifically accurate and statistically significant results that turn customers into raving fans.
LV Purchasing & Employment Plans Index
Valley businesses planning to hire 6,600 new employees in the next 6 months.
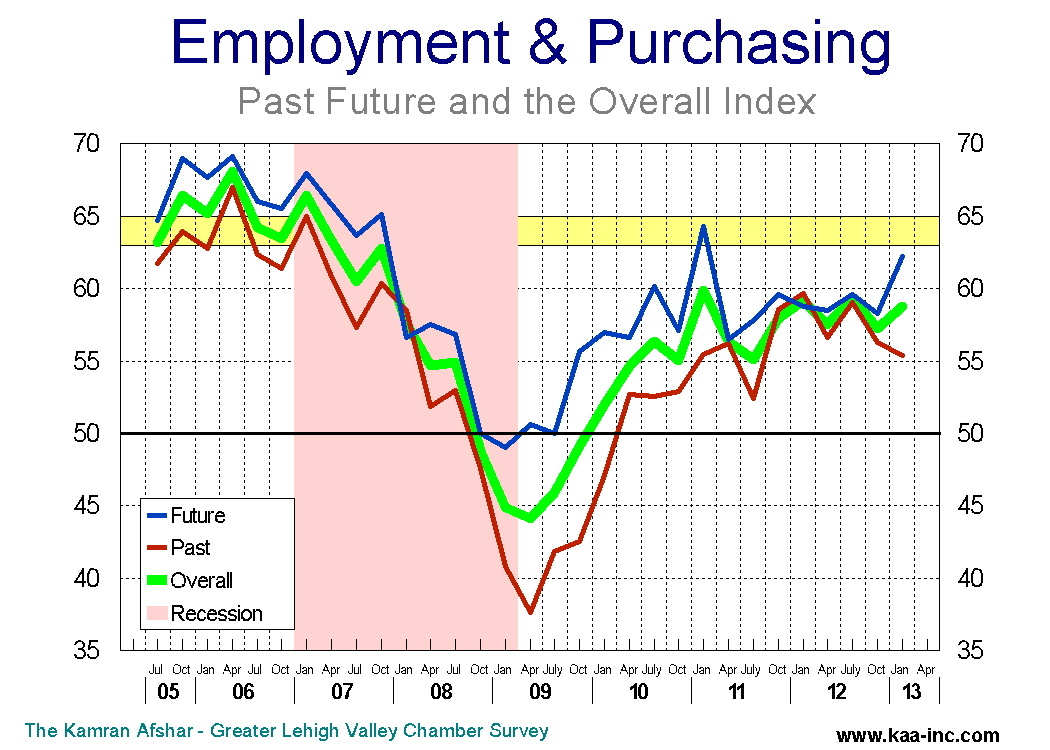
KAA surveys Lehigh Valley businesses on a quarterly basis and collects around 700 observations per year. The Employment and Purchasing Index for the Lehigh Valley highlights the results of these surveys. In April 2013 we conducted our 54th survey of this series. The following is a summary of our findings.
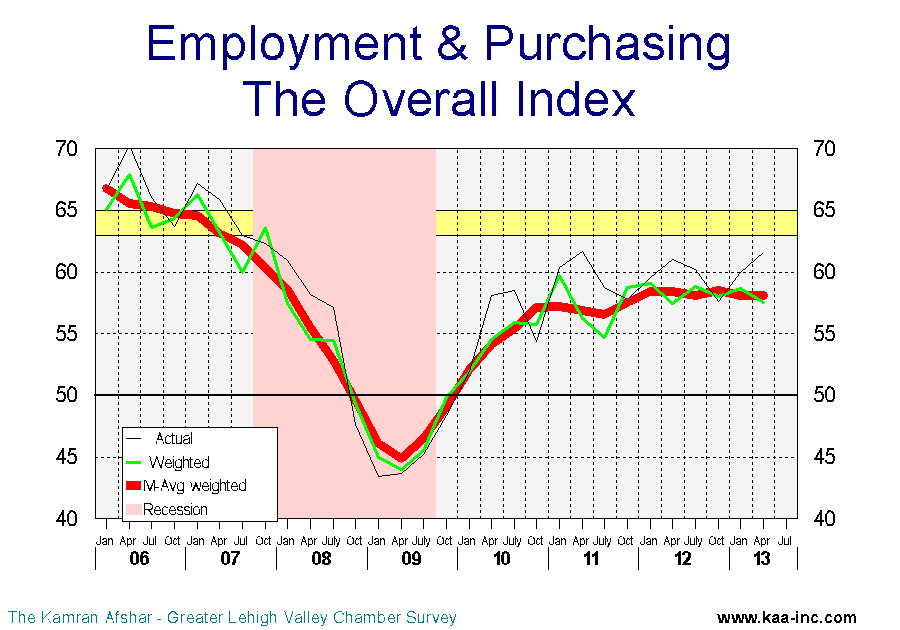
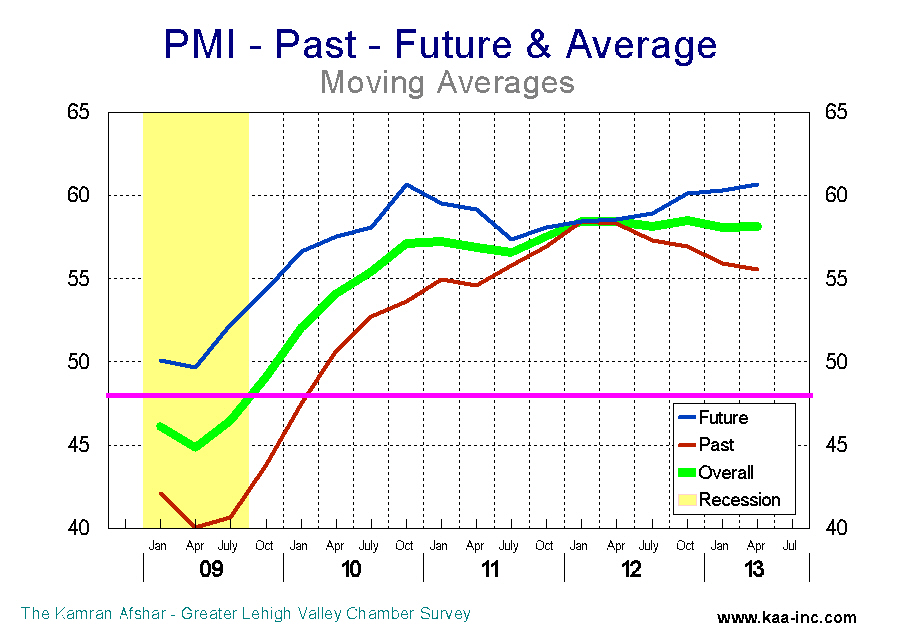
Business sentiment, as measured by the overall index dropped slightly to 57.6 (seasonally adjusted weighted average, SAWA) in April 2013, a 1.9% decline below its January 2013 level. This index has been oscillating between 57.4 and 59.1 since October 2011. Any index above 50 means more than half of the participants were positive about the economy.
This is not dissimilar to the January survey results whereby participants were significantly more positive about the future than the past.
One of the indicators which has shown some decline is the hiring index which shows the number of people who where hired by the participants in the survey. This index, while still in the positive, has dropped 4.8% below its July 2012 level.
The average participant in the survey had hired 0.4 new employees, which is slightly lower than the post-recessionary average of 0.6 new employees.
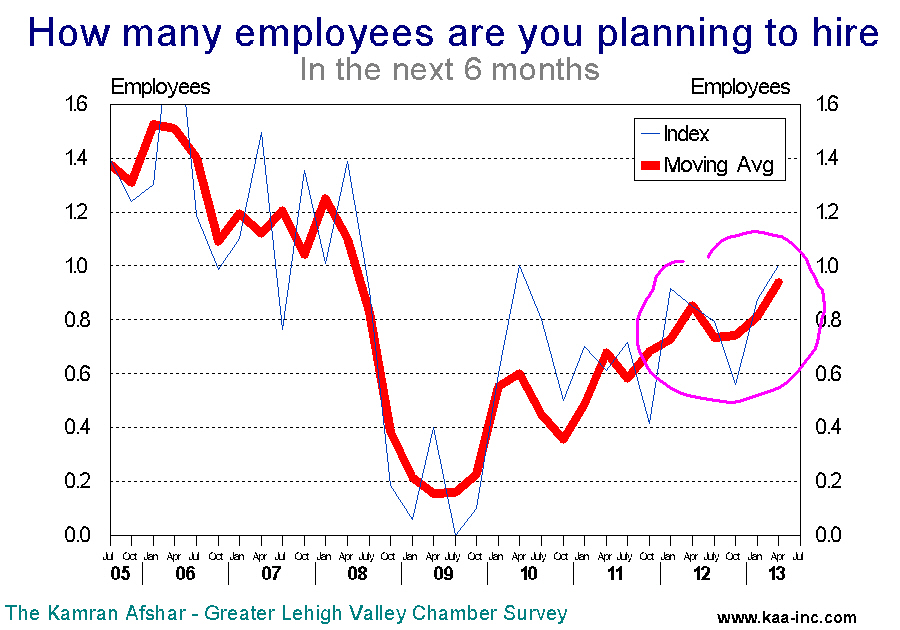
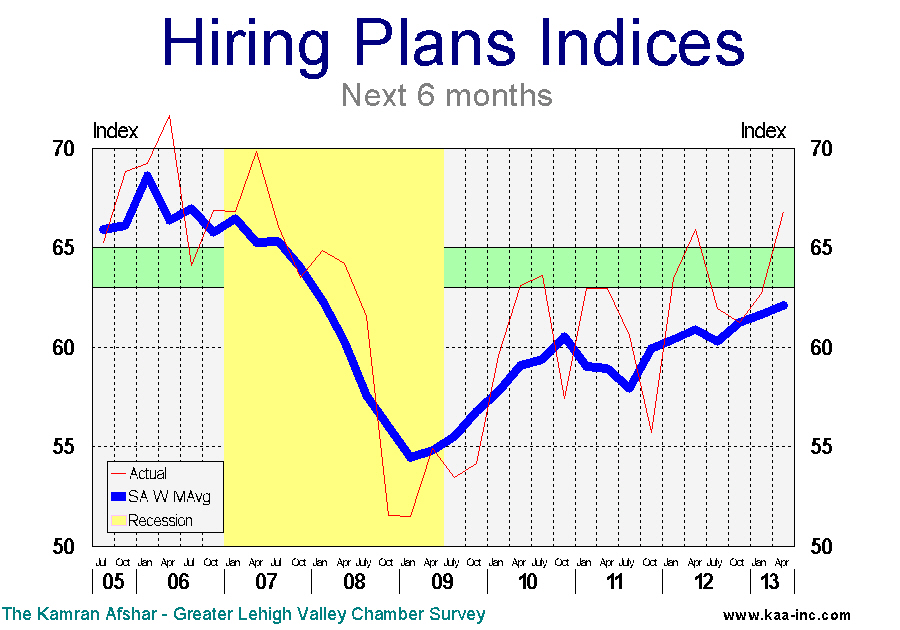
Local businesses are planning to increase employment significantly over the next 6 months. The average participant in the survey is planning to add one more employee in the next 6 months. This translates to 6,600 new employees which translates to a 4.2% increase at annual rates. This indicator is at its highest point since 2007.
Both the short and long-term moving averages indicate a sustained trend which began January 2011 and is continuing. The initial increase in employment wasn’t as robust as the planned since January 2011. Between the first quarter of 2011 and the first quarter of 2012, employment in the Lehigh Valley rose by 3,400 jobs, although businesses did plan to hire 7,300 new employees for that period. But that changed, between then and the first quarter of 2013 the Valley’s employment rose by 9,300, very close to what local businesses had planned which was 9,900 new employees. Based on historical data, local employers usually over-estimate how many people they are going to hire, however, with few exceptions like 2011, their plans are generally not that far off the mark.
The index of plans for future hiring has been oscillating between 59.8 and 63.2 since last April. In April 2013 it stood at 61.0 demonstrating an overall positive attitude by employers, however, it is still short of the exuberant positive level which starts at 65.0. It should be noted that the unadjusted indicator stood at 66.8, the highest for this indicator since 2007.
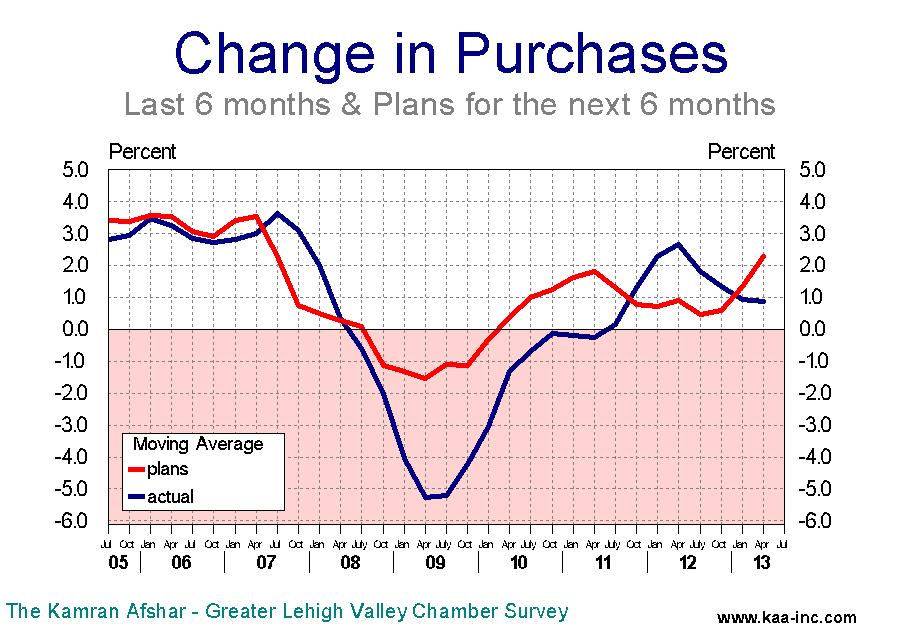
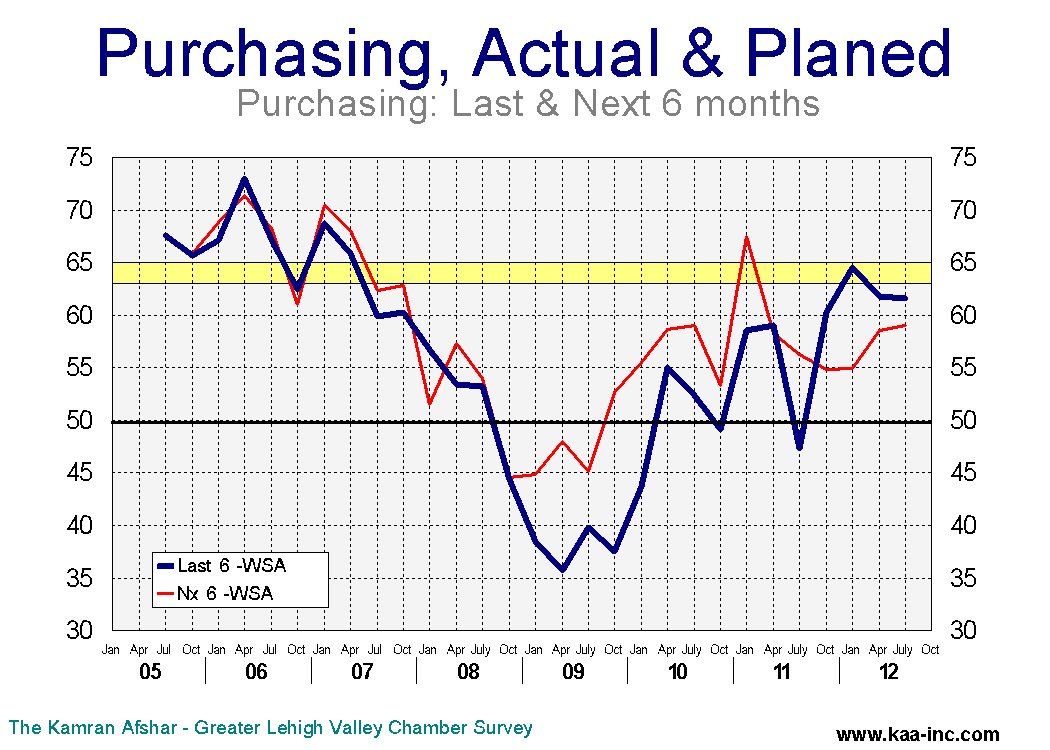
The index of purchasing plans for the next 6 months gave up all its gains for the last 12 months and dropped to 57.8 (SAWA). This index has been going mostly sideways for the last 12 months. However, the average business participating in the survey increased their expenditures plans for the next 6 months from 1.7% in January to 2.8% in April . This number is also more than double the April 2012 level of 1.3%. Indicating that while the number of companies which are planning to increase their expenditures may have not increased significantly, those who were planning to increase their expenditures have upped their plans.
The index of actual expenditures over the last 6 months rose slightly to 57.5 (SAWA) in April 2013. This index also has been oscillating within a narrow band between 56.3 to 60.7 over the last 12 months. Lehigh Valley companies started to increase their expenditures from the middle of 2011 at an increasing rate through July 2012. From then, while increasing expenditures, they were doing it at reduced rates. In January 2013, the average participant in our survey raised their expenditures by zero percent, compared to the previous 6 months. This indicator saw a sharp rebound in April when the average participant raised their expenditure by 1.7% compared to the previous 6 months. We expect to see more increases in this indicator over the balance of 2013.
Between October 2011 and October 2012, planned raises were less than actual increases in expenditures. This was quite disconcerting since the last time we saw such a persistent reversal of normal trends was in July 2007 right before the recession. However, the good news is that for the last two quarters, the order has returned to this indicator and plan increases are again running above actual increase in each quarter.
In the previous issue we referred to businesses changing their assessment of the past and future of the economy in a positive way. We have more evidence that the trend is continuing. While the two indices did not present any difference for a good part of 2012, they have been separating from one another since the end of last year with a better expectation of the future than their assessment of the past. The difference between the two indices started in the 4th quarter of 2012 and is expected to expand; indicating that local businesses believe that the economy’s near future is brighter than its past.
Based on these data it is our expectation that the Valley’s economy will do much better in the next 6 months, especially with a significant increase in employment. We also expect to see local companies continue to increase their purchases at much higher rates than in the past 12 months. Overall, our expectation is for brighter economic situation by summer’s end.
What happened to Inflation?
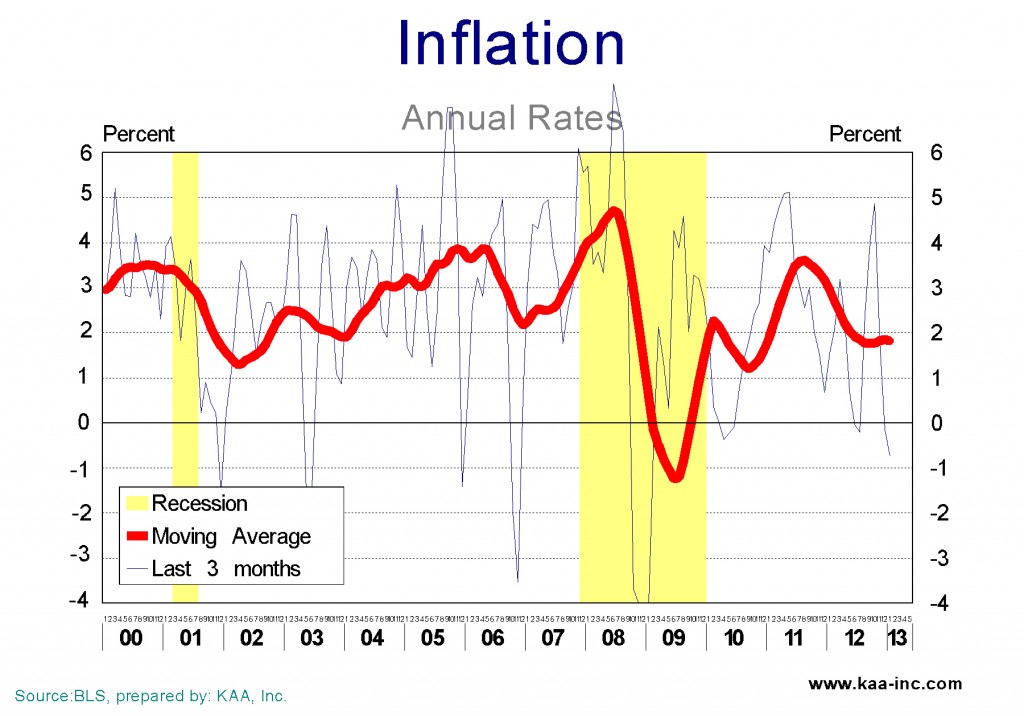
Inflation which was starting to show its ugly face back in 2007-08 was wiped out alongside 8.7 million payroll jobs, the booming housing market, more than 500 commercial banks as well as a large number of other businesses during the Great Recession of 2007-09. The FED also was not all that active during the early months of the Great Recession. The FED eventually discovered in September 2008 that the alarms were for real, and to its credit, it then went to town on raising the money supply. By January 2009 the monetary base was more than doubled. The FED continued to push high powered money into the economy and currently the monetary base is more than 3 times its pre-recession level. Despite pushing all this money into the system, inflation is exceptionally tame. What gives? The Great Recession does. The economy is so badly battered that the velocity of money (the rate of circulation of money in the economy) has crashed, thus while a lot more money is in the economy to go around, since it is circulating a lot slower than it used to, the result is low inflation.
As the recovery gets its running legs back, and employment increases, and businesses start to experience larger and larger sales, the first thing that is going to happen is an increase in the velocity of money. That increase will set a number of alarms off at the FED, if they don’t switch off the alarms again, they will start to pump money out of the economy as fast as they can. Their tool for doing this is selling some of the bonds and papers they have been hoarding in the last four years. This will increase interest rates. Tighter monetary policy is a certainty, the only questions are when are they going to start and how hard are they going to apply the brakes.
Lehigh Valley Payroll Employment Rose Above its Pre-recessionary Highs
Local payroll employment reached a seasonally adjusted volume of 348.4 thousand in February 2013, which is already above the pre-recessionary high of 346.0 thousand recorded in October 2007. While at the national level, average payroll employment is still lagging behind its pre-recessionary highs.
The Lehigh Valley fared better than the average region in the country. Nationwide total non-farm payroll employment dropped by 6.3 percent between January 2008 and February 2010. In the Valley the drop was 4.0 percent, a significantly smaller number.
In the twelve months after hitting bottom, national payroll was up by 1.0 percent, during that same period the Valley’s payroll recorded 1.5 percent growth.
During the following two years of the recovery the increase in the Valley’s payroll employment mirrored the national level with an average annual rate of 1.7 percent. However, due to a smaller contraction at the onset of the Great Recession and slightly stronger growth in the first year of the recovery, the Valley’s payroll employment exceeded its pre-recessionary high by 2,400 jobs or 0.7 percent. At the national level payroll employment still lags behind its pre-recessionary high by 2.7 million jobs or 2.1 percent.
In comparison to the national average, the Lehigh Valley exhibited greater economic strength both during the Great Recession and the first year of recovery. However, and particularly during the last year, the Valley lost its edge and is now growing at a slightly lower rate than the national average.
Businesses more optimistic about the future
KAA surveys Lehigh Valley businesses on a quarterly basis and collects around 700 observations per year. The Employment and Purchasing Index for the Lehigh Valley highlights the results of these suveys. In January 2013 we conducted our 53rd survey of this series. The following is a summary of our findings./p>
Business sentiment, as measured by the overall index rose to 58.8 in January 2013, a 2.7% increase over its October 2012 level. This index has been oscillating between 57.6 and 59.3 since October 2011.
The interesting thing in this data is more about the difference between businesses assessment of the past with their expectations of the future. While the two indices were crisscrossing since October 2011, They started to go their separate ways since October 2012, when the future index ended up 3.6% above the past index. The difference was significantly expanded in January when the future index rose by 12.8% above that of the past. This is the highest relative positive expectation about the future since January 2011 when the future index was 16.0% higher than the past. That was also the end of the upward trend in business sentiment that started in July 2009.
Local businesses plans for future hiring rose to 63.4 in January an increase of 4.8% above its October 2012 level. However, the largest increase in January belongs to plans for future purchases which leaped above its October observation by 8.9%. This index is now at its second highest level since before the Great Recession in October 2007.
Based on these data it is our expectations that, short of another dragged out political battle in Washington, business sentiment in the Valley will rise in the coming months, and with that will come more hiring and increased purchases. While “happy times” are not here again, they are not as far away as they were 3 months ago.
Local businesses show strength on the actual expenditure and hiring; but not so sure when it comes to future plans
KAA surveys Lehigh Valley businesses on a quarterly basis and collects around 700 observations per year. The Employment and Purchasing Index for the Lehigh Valley highlights the results of these surveys. In July 2012 we conducted our 51st survey of this series.
The following is a summary of our findings The Overall Index of Purchasing and Employment Plans for the Lehigh Valley which showed a slight drop in April 2012, recorded a slight growth in July 2012. The July business sentiment index is not statistically different from its January or April 2012 levels. However, it is 7.7% above its July 2011 level. Last year, we observed local businesses becoming more optimistic in the 1st quarter, just to see this enthusiasm erode during the 2nd and the 3rd quarters. This year, we have again observed a significant increase in optimism in January. However, unlike last year, April and July’s data are not dropping, and if anything, the July index is indicative of resumption of growth.
While local businesses are not showing much improvement in their optimism about the future of the economy, their optimism about the last six months has been improving, to the extent that now the two indices are statistically equal. This is unusual since historically future’s index was significantly higher than the past index.
Disappointment with the slow economic growth is making businesses overly cautious. However, the data clearly indicates that despite all of this, businesses are planning to spend more and hire more employees in the next six months.
Retail Sales
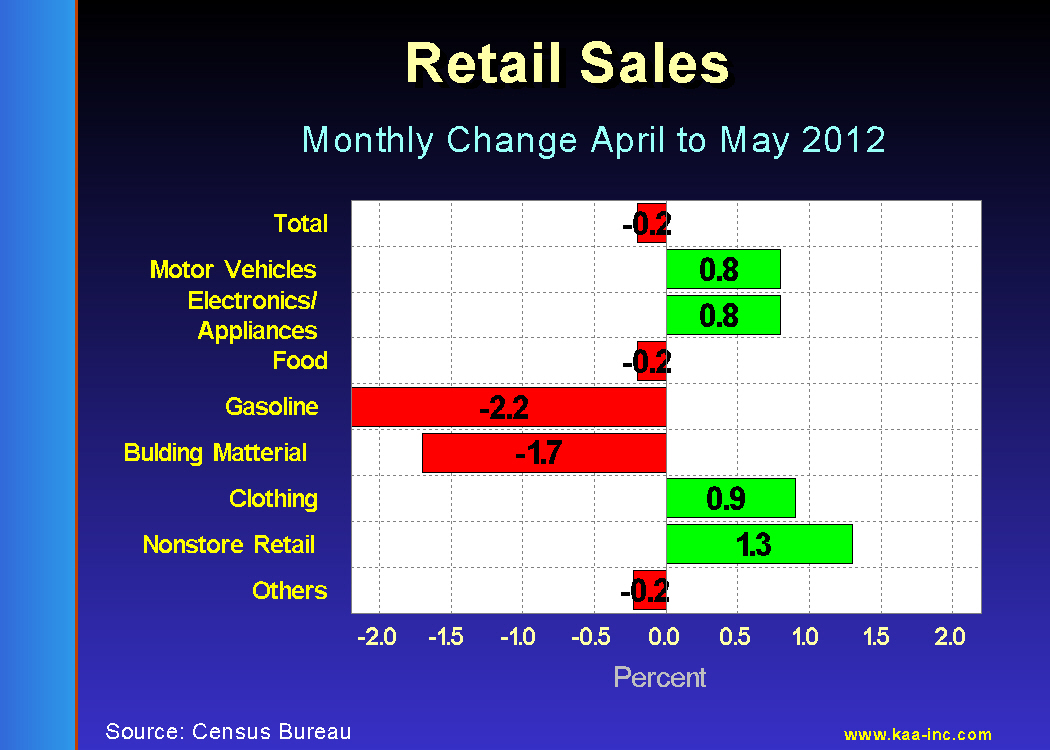
Total retail sales dropped by 0.2% in May as compared to April 2012 according to the Census Bureau’s advanced monthly release. This number may not be as negative as it appears at the first glance. In the first place it is 5.3% above May 2011 which is not all that bad. However, the detail analysis of the components of this number may shed more light on the concept.
The largest decline of components of retail sales was a 2.2% drop in expenditures on gasoline in May. Interestingly enough, this does not mean that we have purchased fewer gallons of gas in May compared to April. That is because the average price of gasoline dropped by 4.3% between the two months (according to the DOE), thus despite the drop in amount of payment for gasoline, we probably purchased
more gallons in May than we did in April.
Building material & garden equipment category, however, shows a significant drop of 1.7% between the two months. This is a leading indicator for the housing market. And it indicates that the housing sector is still far from recovery.
Further analysis of the details of Retail Sales shows that purchases of motor vehicles, electronic & appliances, clothing and particularly, the nonstore (Internet) retail purchases has increased significantly. All-in-all, while the overall May retail sales numbers dropped below expectations, in actuality this indicator was positive for May. Despite a significant drop in the building material purchases, it showed growth, particularly in the discretionary expenditure categories.
New orders for consumer durables
Consumer products that are expected to last a few years are called consumer durables. These include appliances, automobiles, TVs, etc. Consumer durables act as a bellwether of economic cycles.
Consumer products that are expected to last a few years are called consumer durables. These include appliances, automobiles, TVs, etc. Consumer durables act as a bellwether of economic cycles. During recessions, people reduce their purchase of consumer durables due to two basic reasons; one is the fact that these are usually higher priced products. Recessions leave most people with less cash and higher uncertainty. Thus the purchase of these higher priced goods will decline. Second; by their nature, consumer durables last a few years, so during periods of uncertainty, people tend to use these products a while longer without significant loss of utility. By the same token, during recoveries, demand for consumer durables rises, reflecting higher income and confidence levels.
New orders for consumer durables were running between $34b to $36b per month during the economic boom of 2003-2007. The Great Recession crushed this category down to around $20b per month by June 2009. This was 35% below June 2008 and 47% below the March 2003 highs for this index. New orders for consumer durables has been rising at a healthy pace since June 2009. In March 2012, this indicator rose by 38% above its June 2009 lows, however, it is still 27% below its March 2003 highs. Economic recovery along with low interest rates are slowly persuading consumers to get back in the consumer durables market.

Commercial loans up significantly
The decline in lending has ended and banks are consistently adding an average of $15 billion a month
to their commercial and industrial loan portfolios.
The volume of commercial and industrial loans at all commercial banks dropped rapidly as the result of the Great Recession. In October 2008, the total of commercial and industrial loans was $1,608 billion. By October 2010, this number had dropped to $1,204 billion. More than a quarter of these loans were wiped off the asset side of bank ledgers. While only some of the decline was due to the default, all of the income generated form those loans was lost.
Starting in November 2010, the volume of commercial loans started to climb, although still 8% below their previous year. The trend reversal has been continuos since then and by March 2012, the level of commercial and industrial loans has increased to $1,394 billion, 13% above March 2011’s level and only 13% below its all time high in October 2010.
This is a major recovery, however, it should be noted that even at this rate, it will take until April 2013 for the total of commercial and industrial loans to reach their 2010 high.
While the economy is recovering, the rate of recovery is nothing like what we have been used to over the last half a century. The Great Recession was deeper and more devastating than anticipated. Most forecasts, underestimated the rate of decline and projected much faster recovery. The Great Recession, was more than a recession, that’s why all the estimates based on previous recessions forecast faster and stronger recovery. If we change our calculus to compare this with a depression, then our forecasts will be much closer to the reality.
The recovery will continue and the economy and even the housing market will get back to normal. It is, however, important to recognize that this will be a new normal and it will take some time to get there.