


Category Archives: KAA Blog
Lehigh Valley business sentiment Dropped for the third quarter in a row
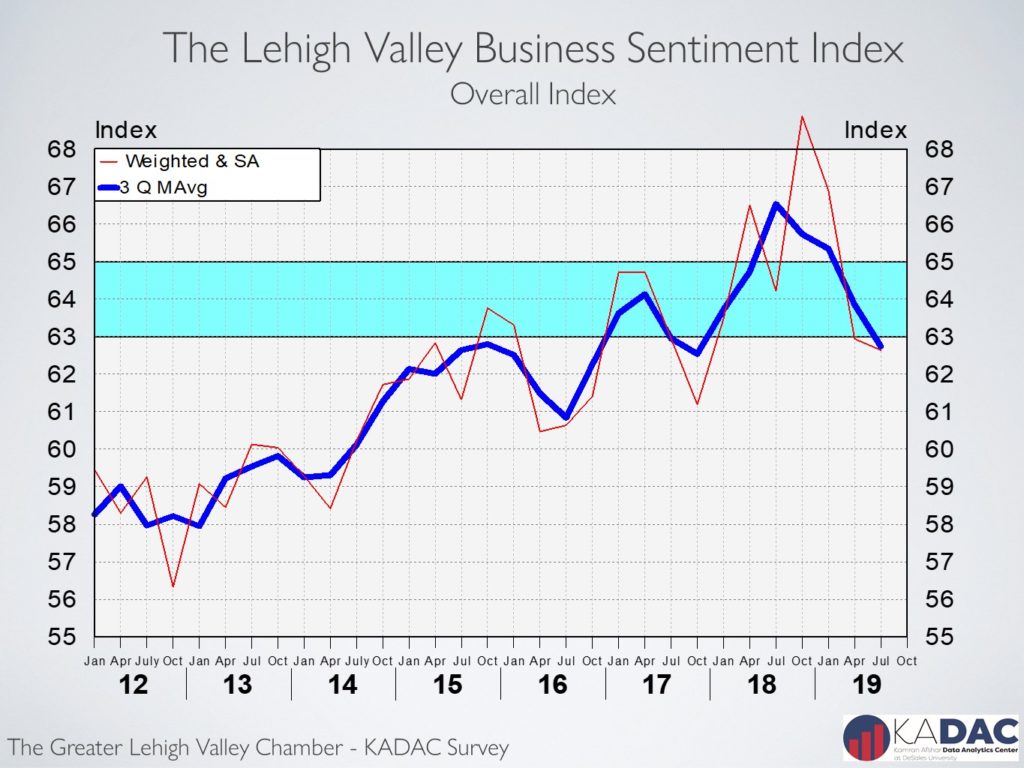
The Greater LV Chamber of Commerce-Kamran Afshar survey of local businesses recorded its third drop in row in the local business sentiment Index in July.
For a little back ground, this is a quarterly survey of the Valley’s businesses that has been conducted since 1998.
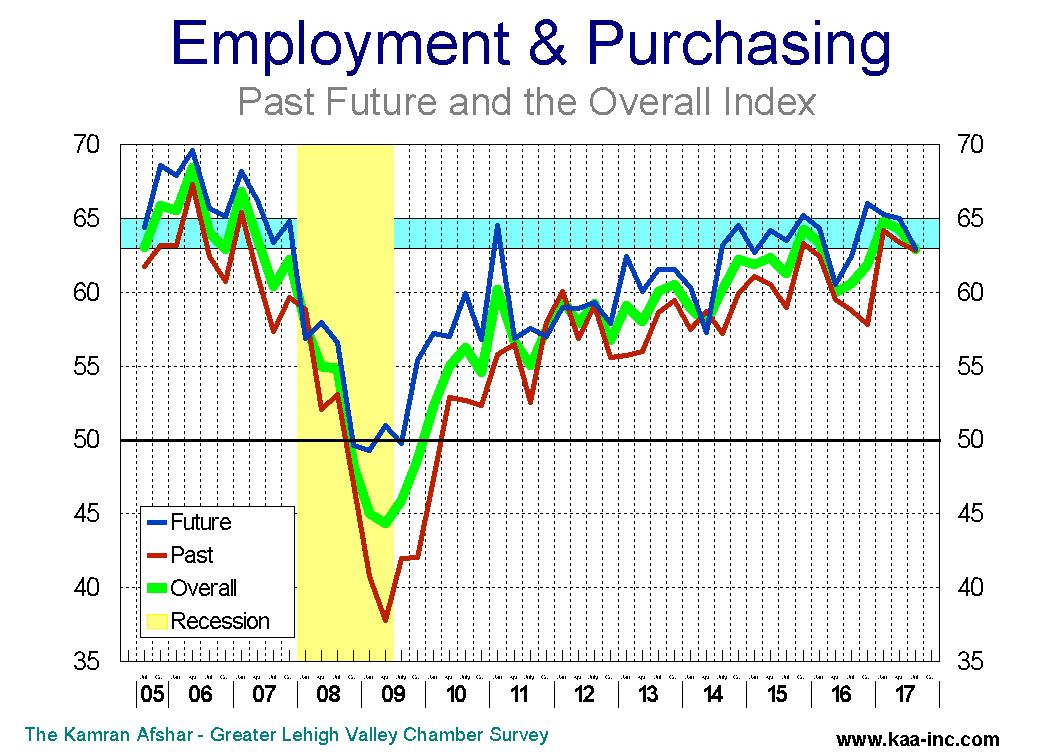
The overall index has dropped in each of the last 3 quarters. The last time it rose was October 2018. The index of business sentiment and the overall confidence in the local economy in July dropped 6.4% below its January level. This now places the index 9.0% below its October 2018’s level.
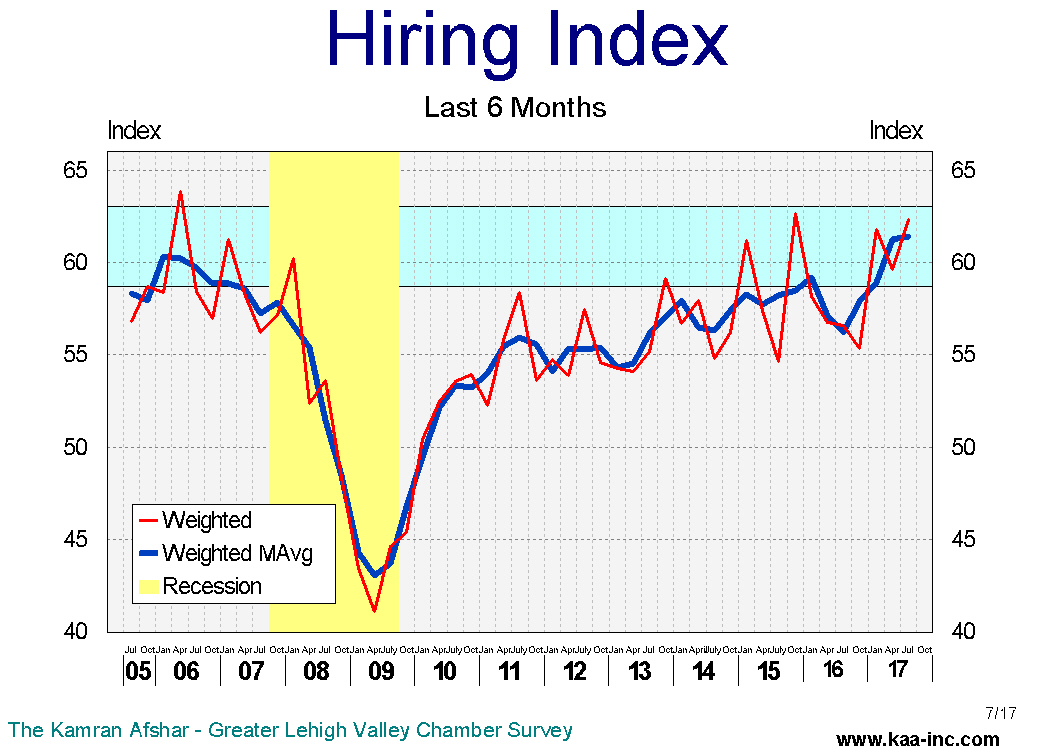
Of the last three drops in the index, the April’s 5.9% drop was the largest. The July survey showed a slight drop with only two of the 4 main indicators in the red. One of the indicators that dropped was the index of actual hiring over the last 6 months which went down by 4.0% during the quarter. This, on top of two other large drops in the previous quarters, places the index of actual hiring 12.2% below where is was in October 2018, a significant decline. It should be noted that while the index of actual hiring, suffered a 12.2% drop in 9 months, it is still running strong. The index is just no longer in the “strong growth” range.
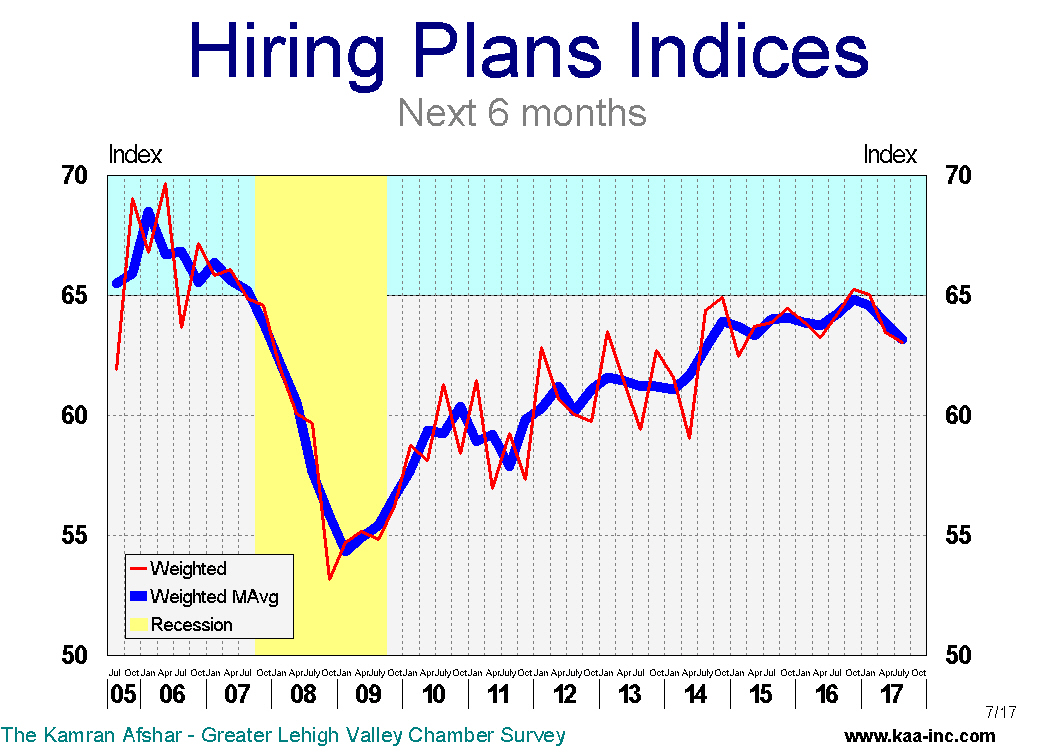
Another index with a large decline since October 2018 is the index of plans for future hiring. Despite recording a slight gain in July, it is still 11% below its October 2018 level.

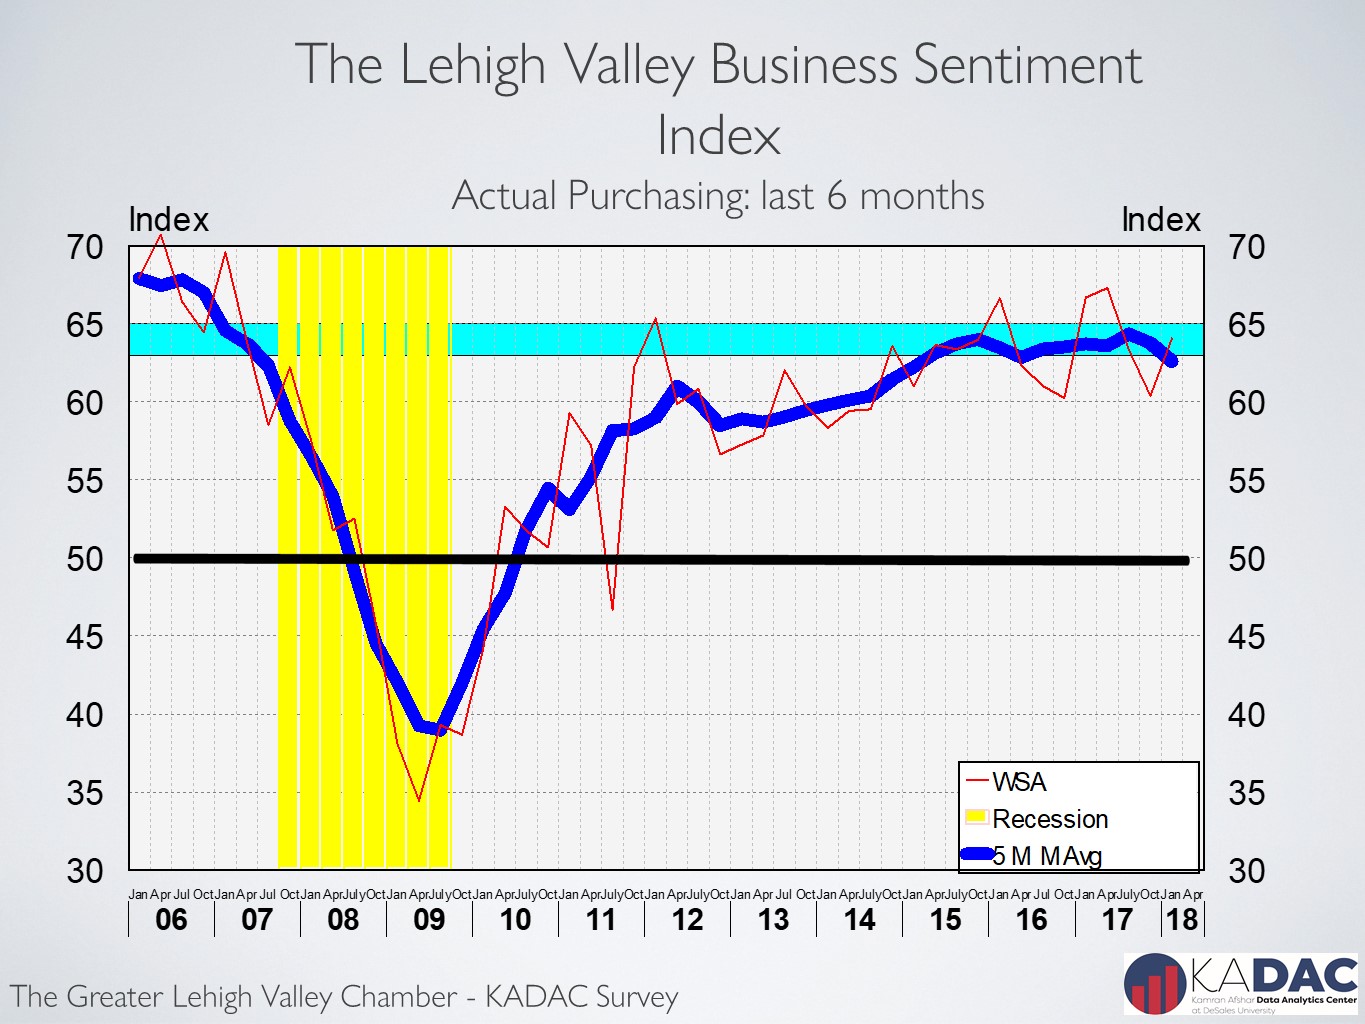
The index for actual purchasing over last 6 months rose slightly in July, now putting it only 5.0% below last October’s level. Despite the drop from last year, the index is still trending in the expansionary range. This is the range that is historically associated with higher rates of economic growth.
It is interesting to note that purchasing plans for the future have been consistently dropping and are now 8.2% below last October level. This index is now trending below the expansion range for the Valley.
Businesses participating in the survey are experiencing a gradual drop in the rate of growth of their revenues. This index has been trending down since July 2017.
One of the leading indicators about the health of the economy is the Purchasing Manager’s Index (PMI). This index has been trending down since August 2018. In the year leading up to September 2019, the PMI dropped in nine out of the 12 months, including every single month since April 2019.
Now, with a full fledged trade war in the background, the economy appears to be moving toward a slowdown over the course of this year and next. The flattening and now inverted Term Structure of Interest Rates is usually a negative indicator for the future of the economy. While this may not be a forecast of a recession, it is a forecast of a slowing in the rate of growth in the US economy.
Lehigh Valley business sentiment highest since 2007
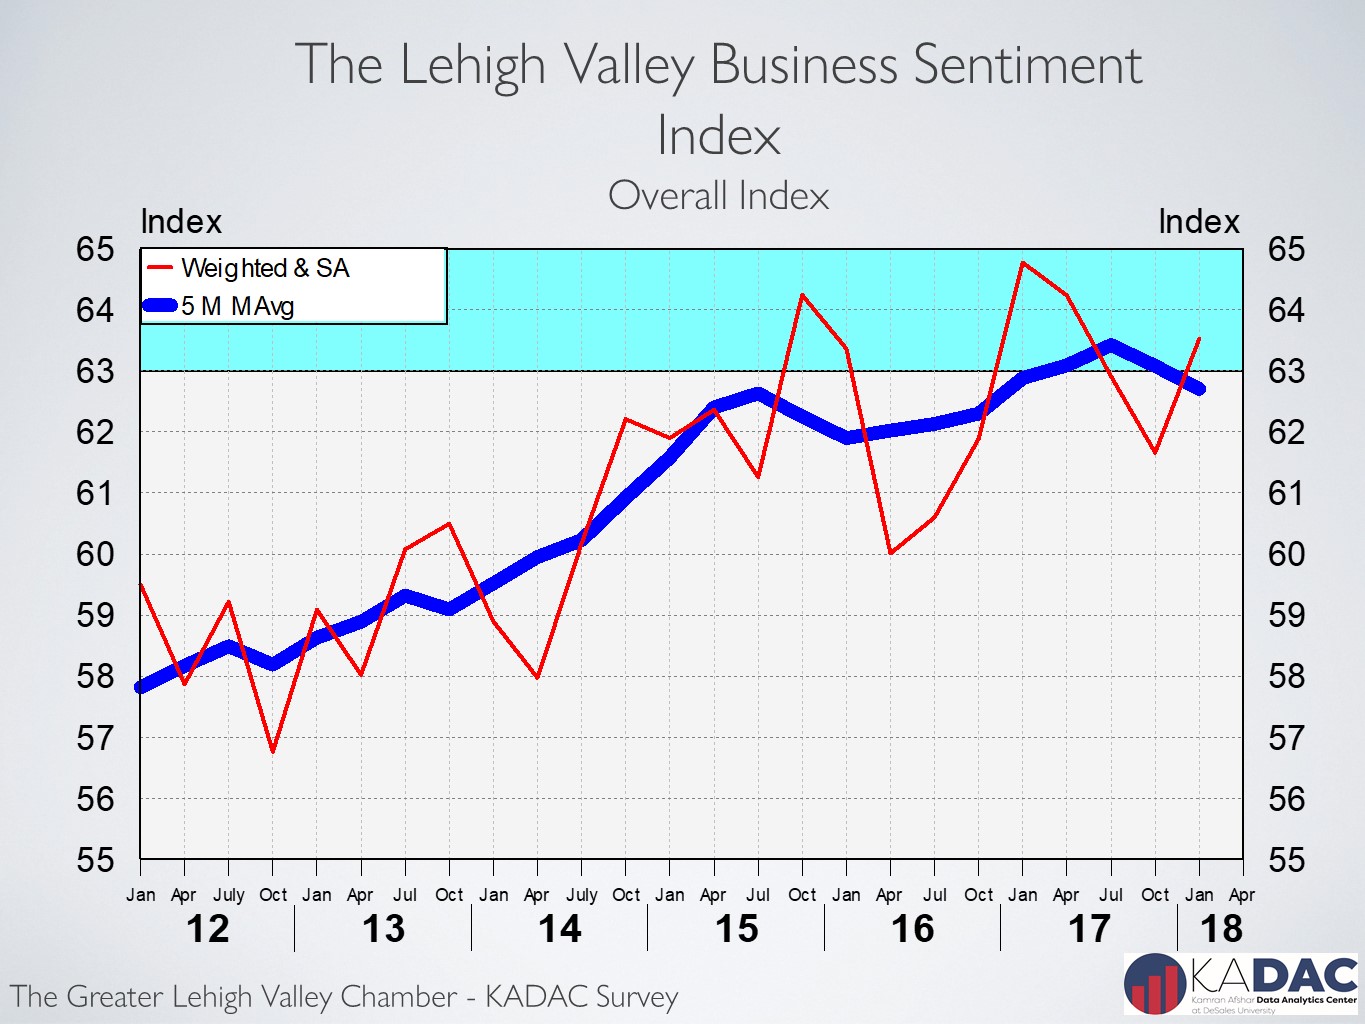
The Greater Lehigh Valley Chamber of Commerce -Kamran Afshar survey of the Valley businesses is a quarterly survey that has been conducted since 1998. In April 2018. The business sentiment index in the Valley rose to its highest level since 2007!
The index of hiring plans for the next 6 months with an increase of 6.9% over its January 2018 level recorded the largest increase among indicators in the model. Employment in the last 6 months also recorded a significant increase in the April survey. The purchasing indices, however, both showed small increases in 2018, while remaining below their April 2017 levels.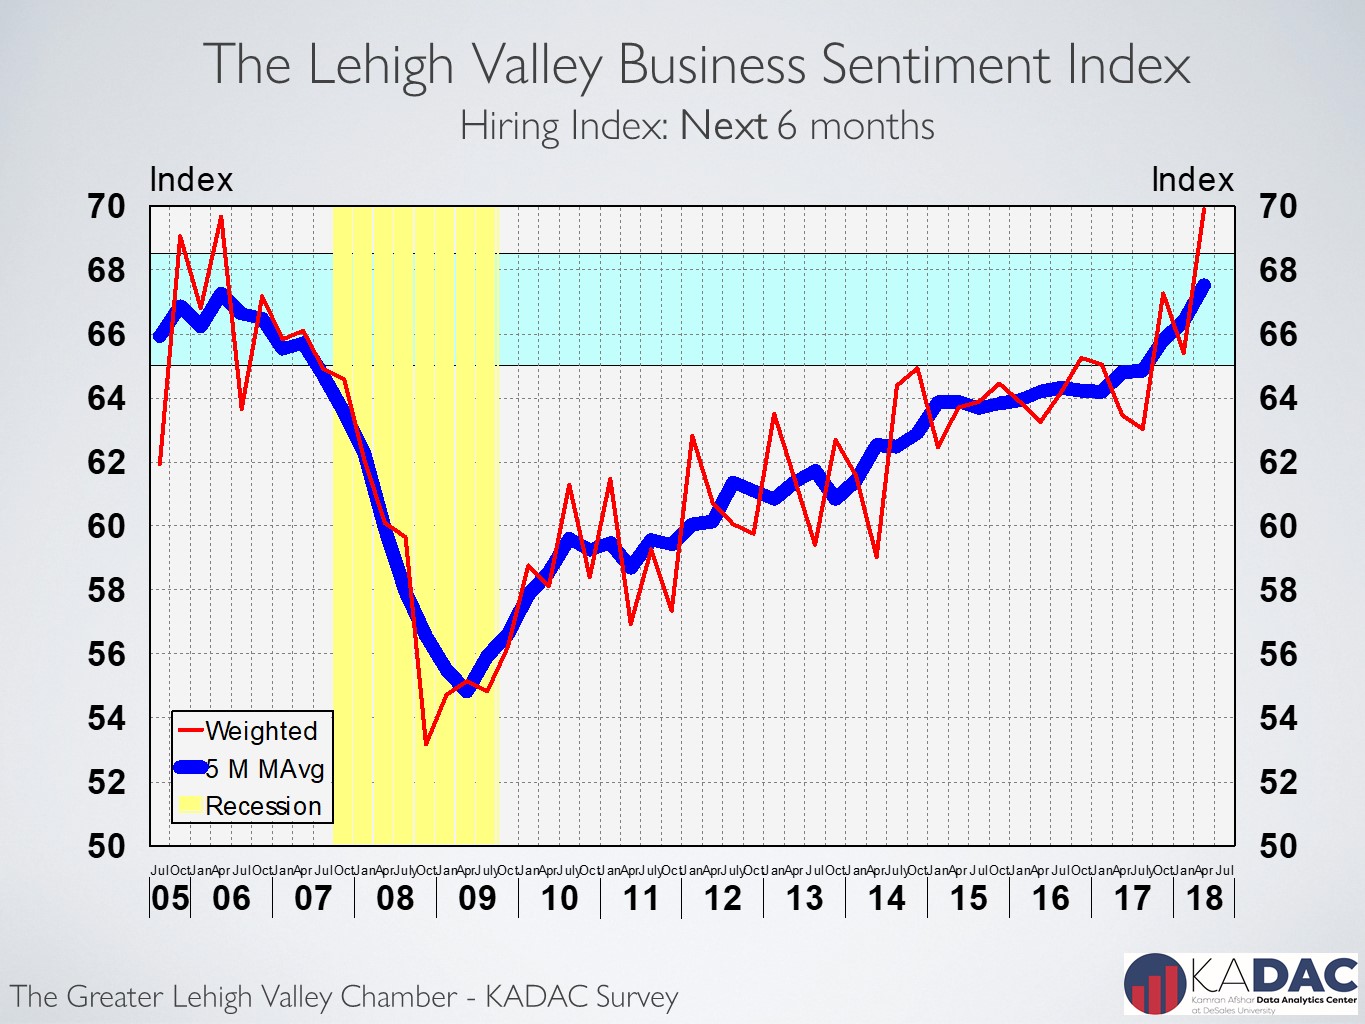
The index of hiring plans for the next 6 months spiked to 69.9 in April, its highest level since July of 1999! This index is now at the top of the range which is historically associated with rapid employment growth in the Valley.
The index of actual hiring over the last 6 months also recorded a significant increase in April 2018, exceeding its April 2017 level by 7.1%. This index is also in range associated with rapid employment growth in the Valley.
Valley businesses participating in the survey have reduced their layoff rates to below their boom years level during 2004 through 2006. A data point which is directly supported by the decline in the number of initial unemployment claims which has now dropped to tight labor market level for the Valley.
The index for actual purchases over the last 6 months while increasing during the last two quarters, is still below its last year’s level and is trending flat. The rapid increase in purchasing during the first 2 quarters of last year appears to have been mostly due to post election enthusiasm. Many of the same businesses have cut back their rate of expansion.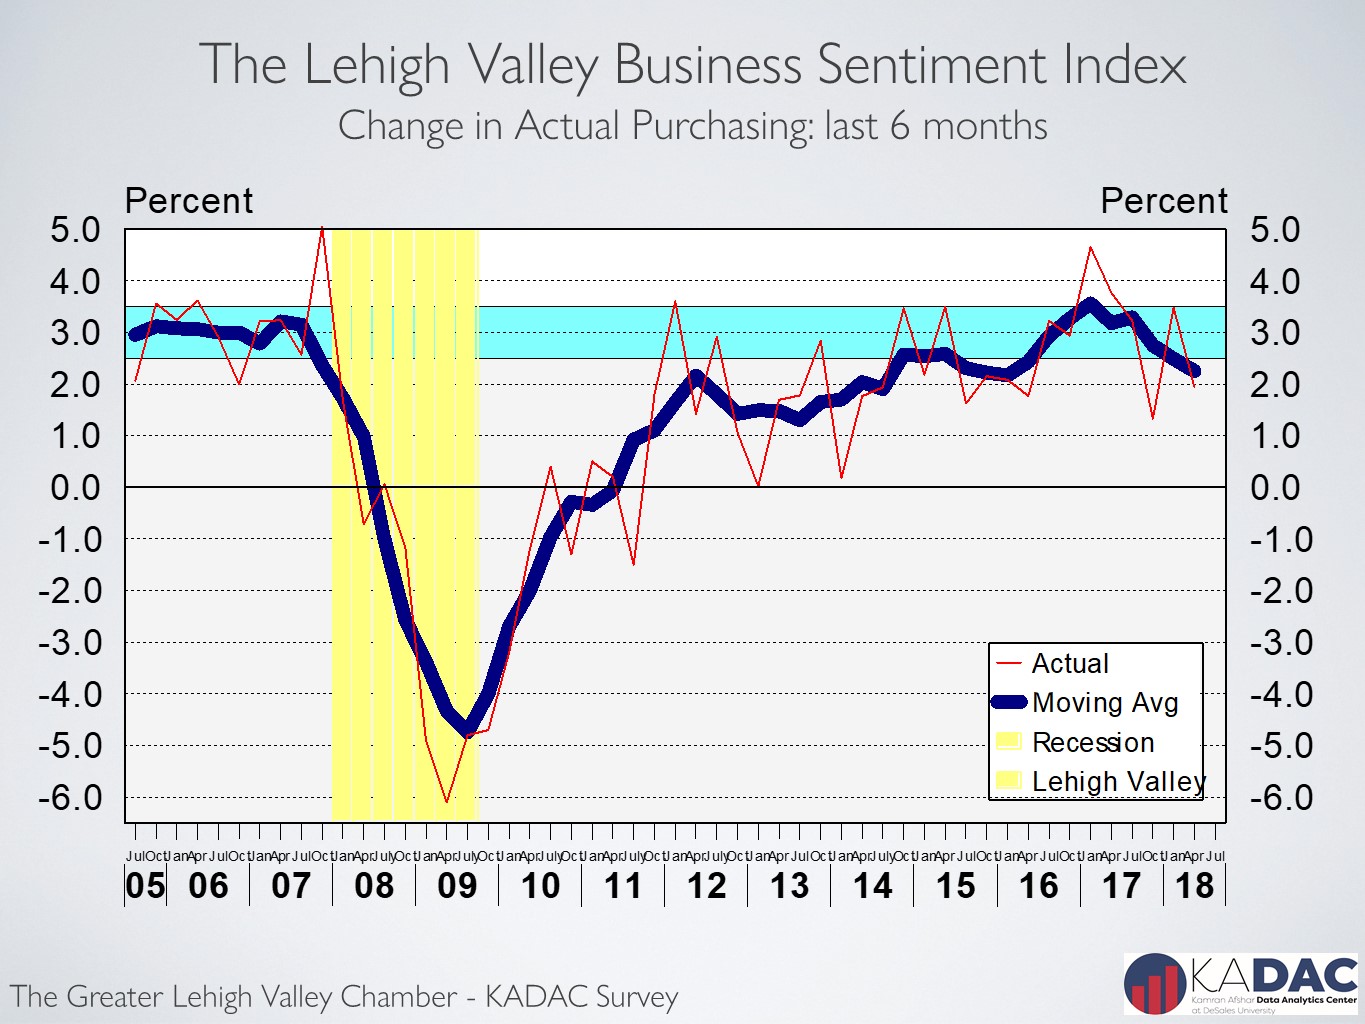
One of the surprising results of our surveys is the observation that the percent of local businesses which had reported increases in their revenues dropped well below its January 2018 level and is at a statistical tie with its April 2017. Also, of concern is the drop of the index of expected future revenues to below its April 2017 level.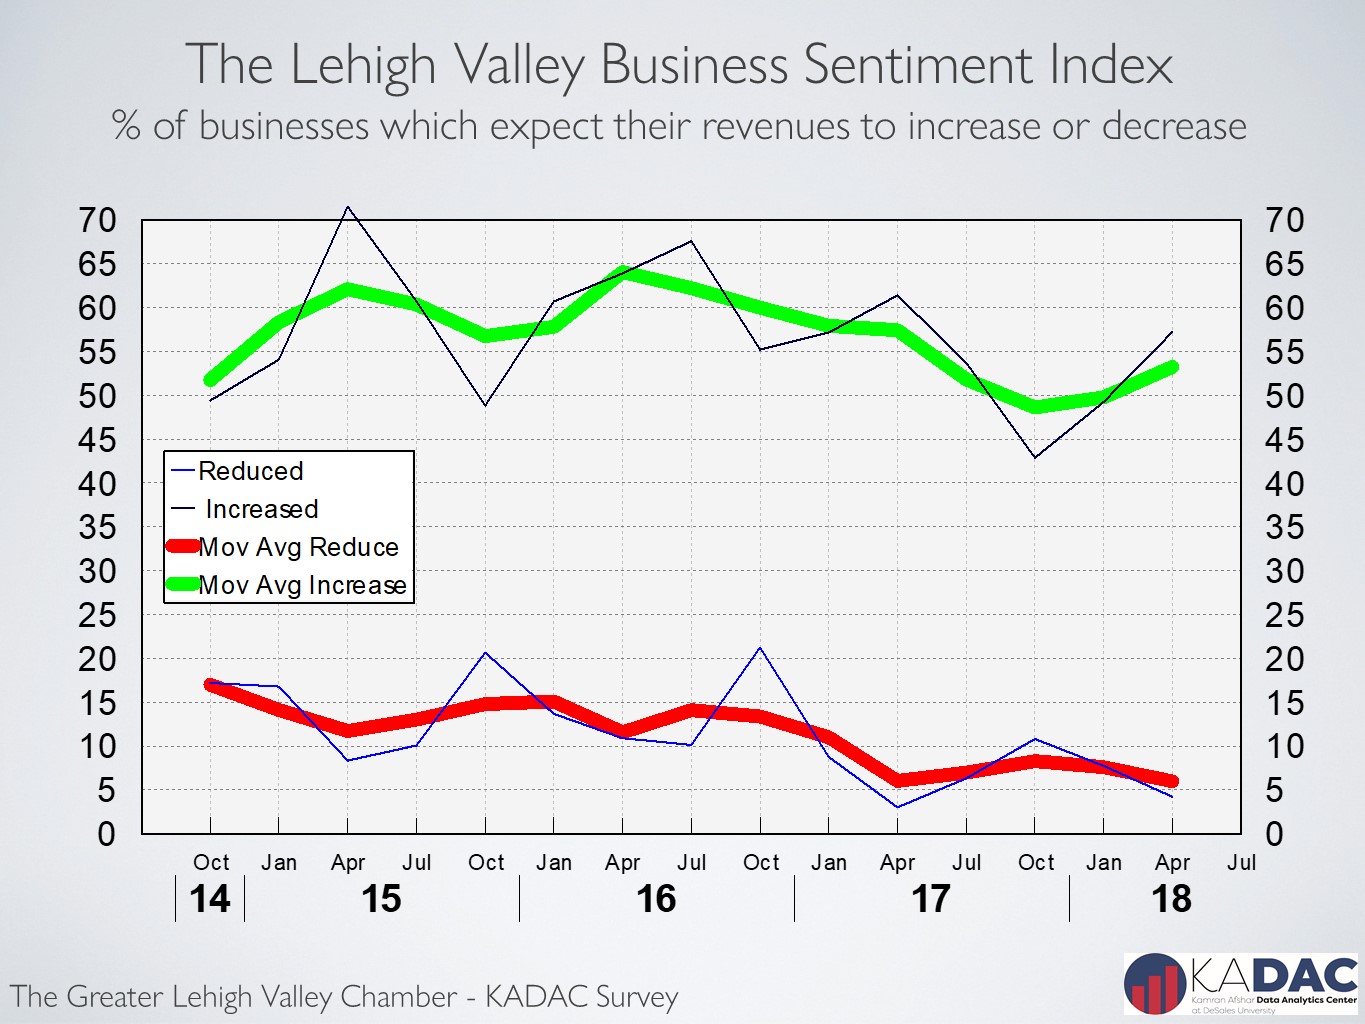
The lower corporate and personal income taxes have moved from the roam of expectation to reality. The trillion-dollar infrastructure bill or anything resembling that is still an expectation. And while we will see increases in consumer and corporate expenditures, at least, through the middle of summer, its sustainability beyond that is being debated. It is however, very clear that the current tax breaks, will cause higher deficits, at the very least, early on. Since the labor market is at full employment level, and deficit is rising rapidly, inflation and higher interest rates are not far behind.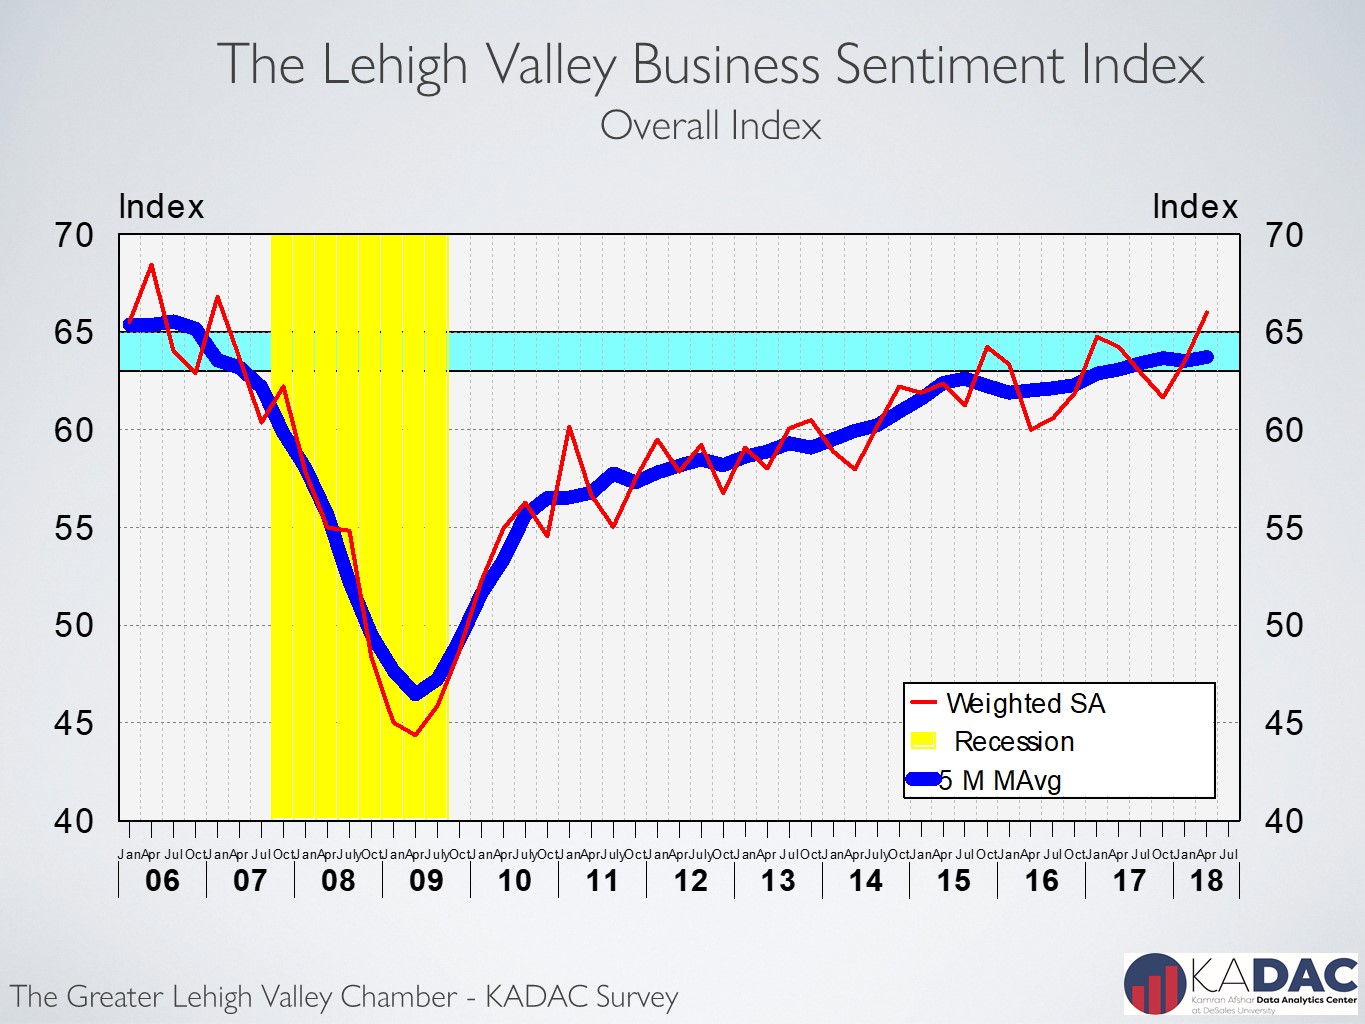
Lehigh Valley business sentiment rose in January after dropping for 3 quarters in a row
The Greater Lehigh Valley Chamber of Commerce -Kamran Afshar survey of the Valley businesses is a quarterly survey that has been collecting data since 1998. The January 2018 survey recorded the first increase in the index after dropping for 3 quarter in a row. However, due to the relatively small size of the January increase, the index is still below its January 2017 level, and it is still trending down.
The index of hiring for the last 6 months rose by a significant 5.3% since October, nevertheless, it is still below its January of 2017 level. Long-term data shows payroll employment in the Valley dropping since June of 2016. While the decline is very small and it looks more like standing still, the fact that its growth has stopped causes concern, particularly since employment at the national level is continuing to grow.
And as usual, the smallest businesses participating in the survey were the most stable in terms of employment. Eight out of 10 businesses with less than 6 employees did neither hire, nor laid off any employees. While only 4 out of 10 companies with more than 100 employees neither hire, nor laid off employees over the last six months.

The index of plans for future hiring dropped slightly in January, however, this index is still trending up.
The index for actual purchasing over last 6 months rose by a significant 6.1% and despite that, it is still below where it was in January 2017. This index, similar to the overall index is still trending down. This is due to its drop in three quarters in a row.
Purchasing plans for the future also rose by a good 4.2% between October of last year and January of this year, however, it is still below its January 2017 level and is also trending down.
A lot of companies increased their expenditures after election based on expectations of rapid economic growth and had to then cut back to makeup for the overshot. With the tax reduction law in the books now, many of the participants in our survey are starting to test the waters again.
The percent of businesses participating in the survey which did report an increase in their revenues in the last 6 months increased in January.
I should add that this indicator was added to our list in 2014, so we don’t have real historical references for it. So our comparison is based on short term data.
One of the surprising results of our surveys is the observation that the percent of local business which expect increases in their future revenues has been slowly dropping since early 2016. This could become a concern should this trend continues.

After the election we clearly observed a spike in Valley’s business sentiment. That, however, quickly went away as expectations were not met. However, with the passage of the tax reduction law, we observed a measurable improvement in the Valley’s business sentiment in January 2018. While the new tax law provides clear benefits for large and multi-national businesses, its value to small and medium size businesses is not as clear. Most companies will discover their true share of this pie in the coming months.
DeSales, Kamran Afshar Partner on New Data Analytics Center

DeSales University is joining forces with Dr. Kamran Afshar, a leading economist, on a groundbreaking new data analytics center that will put students at the forefront of research and consulting.
The Kamran Afshar Data Analytics Center at DeSales University (KADAC) will open in January 2018 in the Gambet Center for Business and Healthcare.
“It is an educational entity,” says Afshar, president of Kamran Afshar Associates, Inc. “It is there to get the students involved in data analytics as it impacts real-life events. We will have heavy student involvement in the process.”
The center will provide paid internships for undergraduate students to conduct research and consulting projects under the guidance of Afshar and select faculty members.
Prospective clients will include banks, retailers, and housing and real estate developers, as well as local and state governments. Students will work real-world client projects — everything from customer satisfaction surveys and business purchasing intentions to economic impact analyses. But the list doesn’t end there.
Afshar also plans to partner with different academic departments and divisions across the University, including healthcare, education, and criminal justice for starters.
“The synergy of working cross disciplines will manifest itself in a variety of different ways,” he says. “This partnership will benefit all stakeholders – business clients, students, the extended Lehigh Valley community, local government bodies, and others. The data analytics field is not limited to one functional discipline; we are only limited by our imagination.”
To read more click here
Lehigh Valley business sentiment down for the 2nd quarter in a row
The Greater Lehigh Valley Chamber of Commerce-Kamran Afshar survey of the Valley businesses is a quarterly survey that we have been conducting for more than twenty years. According to the July 2017 survey, business sentiment and the overall confidence in the local economy dropped for the 2nd quarter in a row and gave back almost all its January gains and is now statistically back where it was last October. The drop was across the board with the exception of hiring in the last 6 months which rose above its January 2017 level. It is clear that post election enthusiasm among businesses in the Valley has vanished, but it has not been replaced with doom and gloom.
Actual payroll employment in the Valley declined by 3,700 jobs (SA) between August of 2016 and August 2017. And this is going in the opposite direction of the national average which added 2.1 million jobs during the last 12 months. By that account we should have gained 5,100 jobs instead of losing 3,700. This is a pretty sizable and unexpected decline.
There are other interesting twists and turns in the employment data; The index for actual hiring for the last 6 months rose to 62.3 (seasonally adjusted and weighted, SAW) in July, its highest level in two years, and it is trending inside the expansion zone based on historical data.
Also of interest are two other indicators showing the Valley’s labor market as very tight; first, the number of unemployment claims, both initial and continuous are down close to the level of the tightest labor markets in the Valley in the last 30 years. And second is that the July survey which shows current layoffs to be lower than even the ones in 2004-2006 at the height of the economic boom before the recession.
The smallest businesses in the Valley, those with less than 6 employees, were the ones who changed their employment structure the least. Three quarters of them did not hire or layoff anybody. This doesn’t mean nothing happened, 22% of them hired new employees while only 3% laid off people during the last 6 months.
% of Companies which increased or reduced employment based on size (July 2017)
| Employees | 1-5 | 6-10 | 11-20 | 21-50 | 51-100 | 100+ | Avg |
| Reduced | 3% | 6% | 4% | 6% | 14% | 14% | 7% |
| the same | 76% | 67% | 44% | 53% | 41% | 31% | 55% |
| Increased | 22% | 28% | 52% | 41% | 45% | 55% | 39% |
| Net increase | 19% | 22% | 48% | 35% | 31% | 40% | 32% |
The largest companies in the Valley, those with more than 100 employees showed the most movement. More than half of them hired new employees, while 14% of them laid off people during the same period.
The index of plans for future hiring dropped in July and it is now not only below its January level, but it is even lower than its July 2016 level – the only indicator in the model which fell below its last year’s level.
While in April, 8 out of 10 businesses with between 51 and 100 employees were planning to increase employment, in July that number had dropped to 5 out of 10. This is repeated for almost every size category.
The index for actual purchasing over the last 6 months dropped more than any other index in the model in July, falling 6% below its April level, and while still above its last October’s level, all its gains since the election have been wiped out.
Purchasing plans for the future also recorded a large loss in July, not only giving up all its post election gains, but also, it fell even below its last October’s level.
It should, however, be noted that both actual purchases in the last 6 months and purchasing plans for the next 6 months are still in the expansionary range, albeit at the bottom of the range.
Percent of businesses participating in the survey which did report an increase in their revenues in the last 6 months rose, but the average increase in their revenues recorded a slight dip compared to April.
Business expectation of future revenues after a spike in January and April has dropped back close to where it was last October, and its trend is now slightly downward.
In July, the overall business sentiment index dropped for the 2nd time in as many quarters. Local business sentiment gave back almost all of its January gains and is now in a statistical tie with its October 2016 level.
The survey of Lehigh Valley businesses shows that their general optimism which surged forward in January is gone and we are almost back to where we were last October. In July expenditure indices as well as the index for expected future revenues dropped significantly. It is very clear that local businesses have lost almost all the enthusiasm they showed in January.
Lehigh Valley overall business sentiment eased down slightly in April
The Kamran Afshar- Greater Lehigh Valley Chamber of Commerce survey of the Valley businesses is a quarterly survey that we have been conducting for the past twenty years. According to the April survey, local business sentiment gave back some of its January gains but it is still above its last October’s level. The drop from January came almost entirely from the employment sector; local employers have reduced their actual as well as planned hiring since January.
The index for actual hiring for the last 6 months dropped to 59.6 (seasonally adjusted and weighted, SAW) in April, below its January level of 61.8 (SAW), giving up 3.6% of its gain in January. This dropped the index slightly below the range which is historically associated with faster growth in the Valley. Local employers are not only facing a smaller labor pool, but of more significance, they are facing a shallower pool of skills and expertise within the remaining labor market; be it from high tech to low tech to no tech, many positions remain vacant for lack of qualified applicants.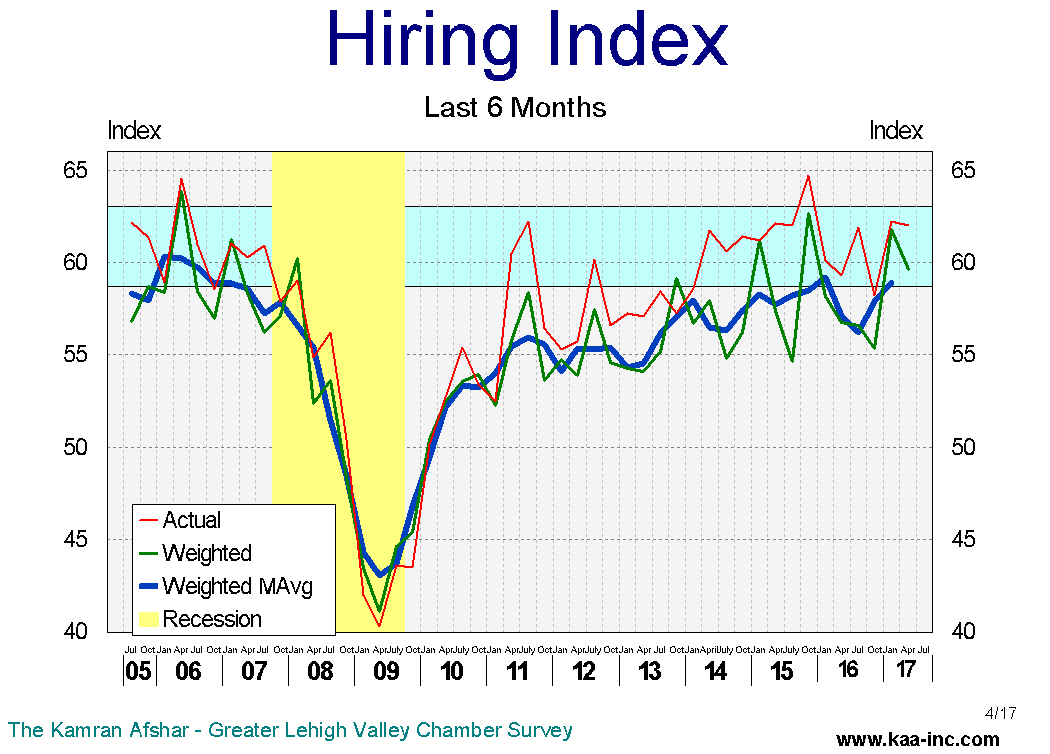
In the last 6 months, while local businesses hired more people, many of then trimmed their hiring back from what it was in October 2016 and January 2017.
The smallest businesses in the Valley, those with less than 6 employees, which composes 55% of all businesses operating in the Valley changed their employment structure the least, 73% of them did not hire or lay off anybody and only a net 13% of them hired additional employees during the last 6 months. The largest companies in the Valley, those with more than 100 employees, which composes 3% of all the business here, showed the most movement. Almost half of them hired new employees, but this was not all gain, a quarter of them laid off people during the same period. All said, a net 26% of them hired additional employees during the last 6 months, and this is down from a net 47% in January.
Transportation and warehousing industry has the lead in the number of new employees hired per company in the last 6 months. This is also the fastest.![]()
The index of plans for future hiring also dropped in April. This index lost a relatively small 2.4% of its value since January. However, this drops the Plans for Future Hiring Index below the range which is historically associated with faster growth in the Valley.
In the Valley, 8 out of 10 businesses with between 51 and 100 employees reported that they are planning to increase employment at their location. This is by far larger than any other group in our survey and is probably indicative of their business agility which larger companies lack and financial ability which smaller companies may not be enjoying.
Transportation and warehousing industry is again in the lead among all the participants in the number of new employees that they are planning to hire in the next 6 months.
The index for actual purchasing over last 6 months rose a shade to 67.3 (SAW) in April, an increase of 0.9% over its January level. However, it is a significant 7.9% above its April 2016 level. This index has now moved into the expansionary range since January.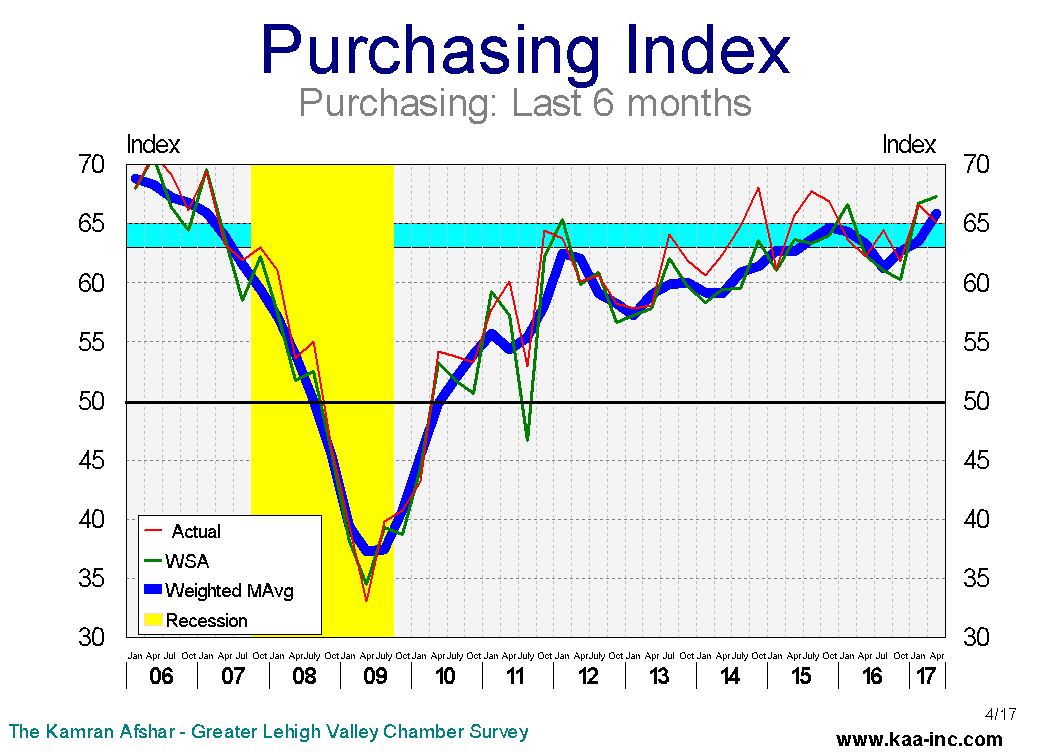
We also observed an interesting role reversal in April, the percent of larger companies which increased their expenditures dropped while that of the smaller ones rose.
Purchasing plans for the future also recorded a small increase over its January level, rising to 66.5 (SAW) . This index also has crossed into the range which is historically associated with faster growth. And interestingly enough the largest increase in planned expenditures, percentage-wise, comes from businesses with less than 11 employees.
Businesses participating in the survey did not experience an increase in their revenues in the last 6 months. General revenues of the local businesses participating in our surveys has been showing a slight decline since July 2015.
The larger companies in the Valley reported a small drop in their revenues while the smaller ones experienced increases in theirs.
It should be noted that this indicator was added to our list in 2014, so we don’t have real historical references for it and therefore any comparison is based on short term data.
While local business expect their revenues to increase in the next 6 months, according to the April survey, their expectations did not rise anywhere close to what was anticipated with the tax cut and the stock market surge since the election. And not unexpectedly, the smaller businesses’ expectations are even lower than the rest.
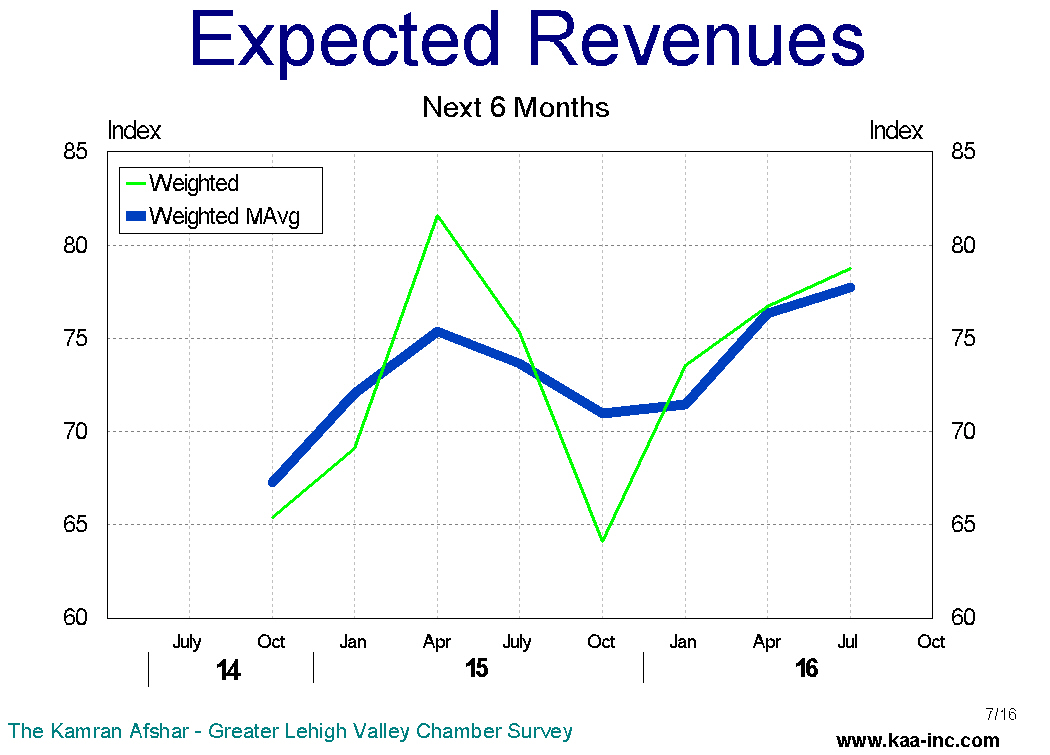
The index of expected revenues for the next 6 months rose in April, however, the trend for this indicator has been relatively flat.
The survey of Lehigh Valley Businesses shows that the general optimism among local businesses which sprang up in January has lost some of its shine. The expenditure indices moved up in April, and that is a sign of enthusiasm. However, the drop in employment indices indicated uncertainty. It appears that the “more-enthusiastic” January survey was tempered in April with a good dose of caution.
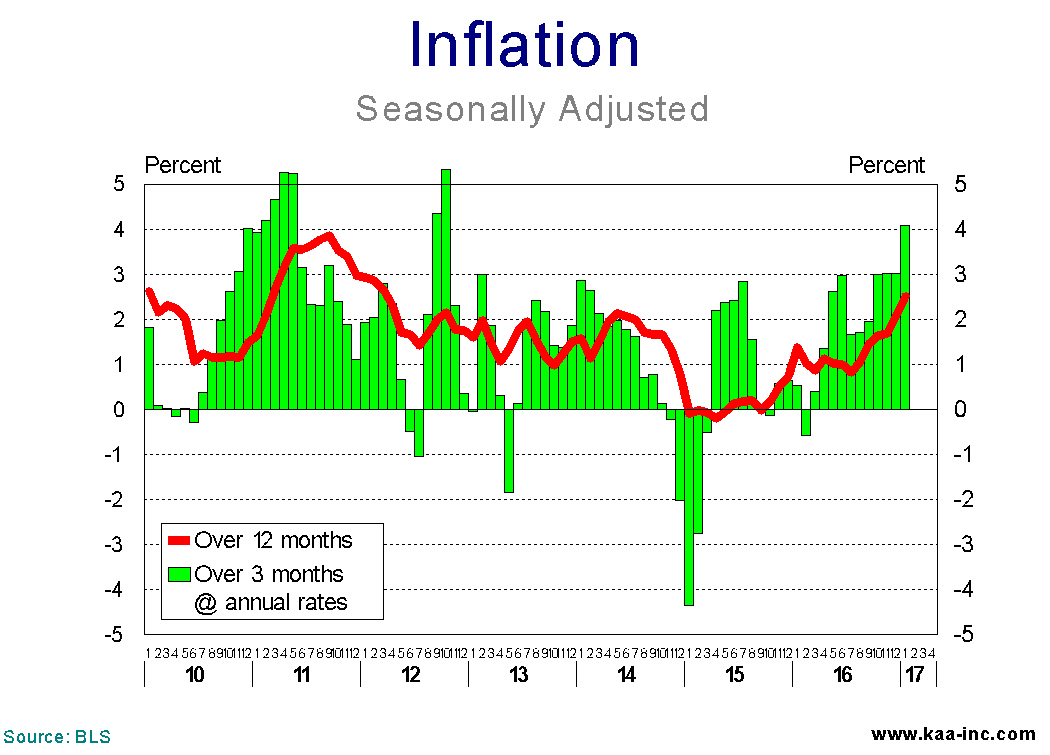
CPI rose by a whopping 0.6% in January
The Consumer Price Index (CPI) increased 0.6% in January on a seasonally adjusted basis according to the BLS. And while this is an increase of only 2.5% over the last 12 months, over the last 3 months, inflation has been rising at an annual rate of 4.1%.
According to the BLS, the January increase was the largest since February 2013. A sharp rise in gasoline prices accounted for nearly half the increase, and advances in prices for shelter, apparel, and new vehicles also were major contributors.
Lehigh Valley overall business sentiment rose in January
Business sentiment and the overall confidence in the local economy spiked in January over its October 2016 level according to the Kamran Afshar- Greater Lehigh Valley Chamber of Commerce survey. This is a quarterly survey of Lehigh Valley businesses which we have been doing since 1997. The increase in confidence was entirely due to the local businesses significant increase in their hiring and spending during the second half of 2016, while, interestingly enough, they trimmed down their plans for hiring and spending for the first half of 2017.
The hiring index for the last 6 months rose significantly in January, jumping by more than 10% above its October 2016 level. And it is back again in the range which is historically associated with faster growth in the Valley. The index visited this range briefly in 2015 also. Local employers are not only facing a smaller size labor pool, but of more significance, they are facing a thinning of skills and expertise within the remaining labor market. From high tech to low tech to no tech, many positions remain vacant for lack of qualified applicants.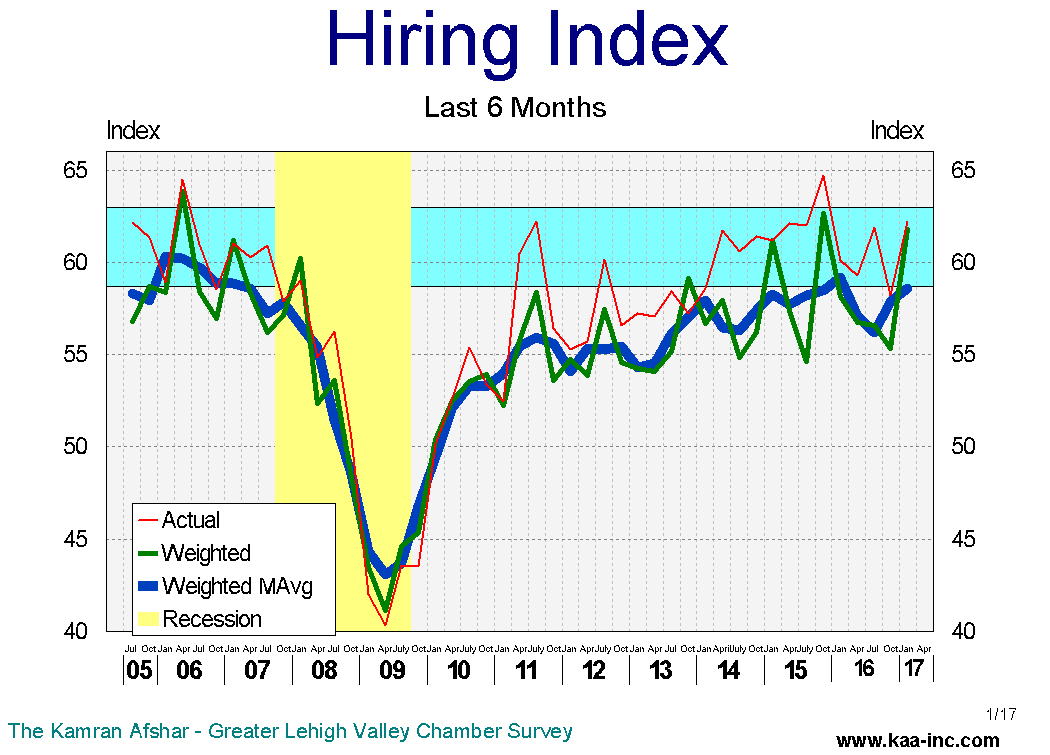
The purchasing index for last 6 months also recorded a more than 10% jump in January, pushing it to its highest level since 2007, before the recession.
It is however, most intriguing that the same businesses which reported such a large increase in their expenditures and hiring over the last 6 months, trimmed down their plans for future expenditures and hiring. The future index, while still indicates expansion, declined slightly in January.

More than half of the local businesses with more than 100 employees reported net addition to their payrolls, while only 6% of them had net layoffs, according to the January survey. The larger companies in the Valley also led in the percentage increase in their expenditures. Sixty-five percent of them reported increases in their expenditures, while 18% cut back spending during the second half of 2016.
The smaller companies, those which have between 6 and 20 employees have the lead in plans for future hiring, with 44% of them planning to increase their employment levels in the next 6 months. And the smallest companies, those with fewer than 6 employees, which, incidentally, constitute half of all the businesses in the Valley, have the lead in planned future expenditures, with 33% of them planning to increase their spending during the first half of 2017.
The survey shows general optimism among local businesses. And one of the most tell-tell signs of the January survey is that the sharp improvement in the local businesses assessment of the past, came alongside with a slight decline in their sentiment about the future. This indicates great enthusiasm with some measure of caution about the future.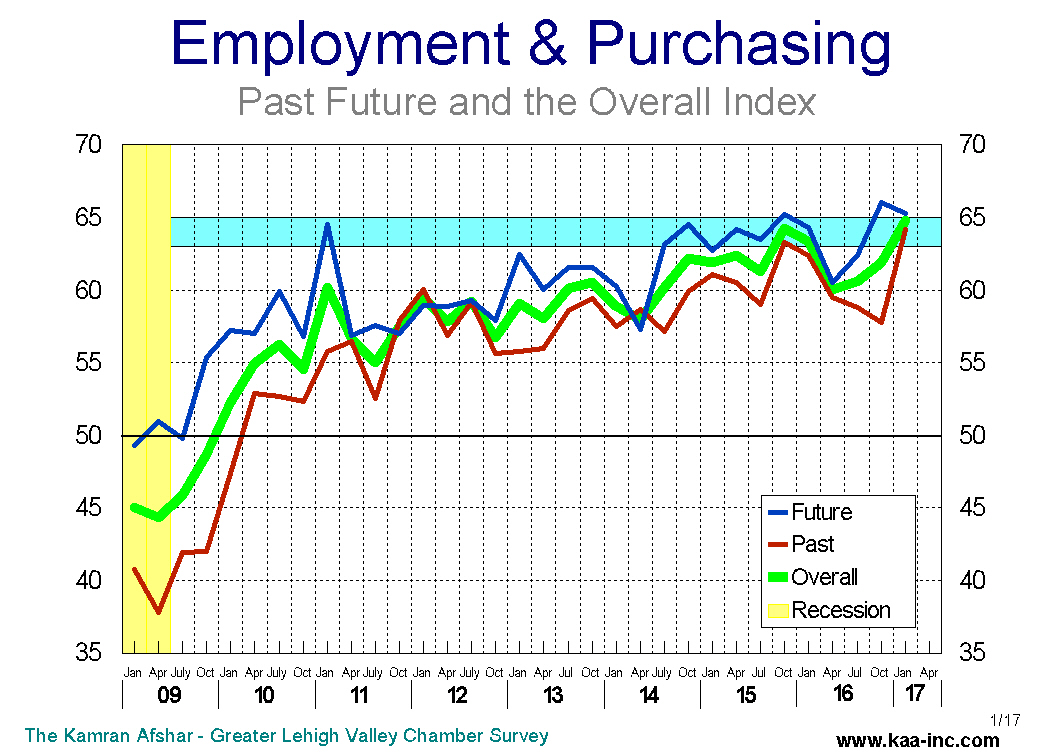
Lehigh Valley overall business sentiment up slightly
The Kamran Afshar- Greater Lehigh Valley Chamber of Commerce survey of Lehigh Valley businesses is done on a quarterly basis. In October we conducted our 68th quarterly survey of these series, and according to the survey, business sentiment and the overall confidence in the local economy rose slightly over its July level. Almost all of the increase was due to a sizeable expansion in business plans for future purchases.
It should be noted that this survey was completed by October 19th, almost 3 weeks before the election.
In October, the index of plans for purchases over the next 6 months leaped by 10% above its July’s level, bring it to its highest level in the last 6 years. And of equal importance is that this index has now moved into the range that is historically associated with strong growth. Businesses with 21 to 50 employees have the lead in the October survey, where 45% of them are planning to increase their expenditures, while only 3% are planning cutbacks. 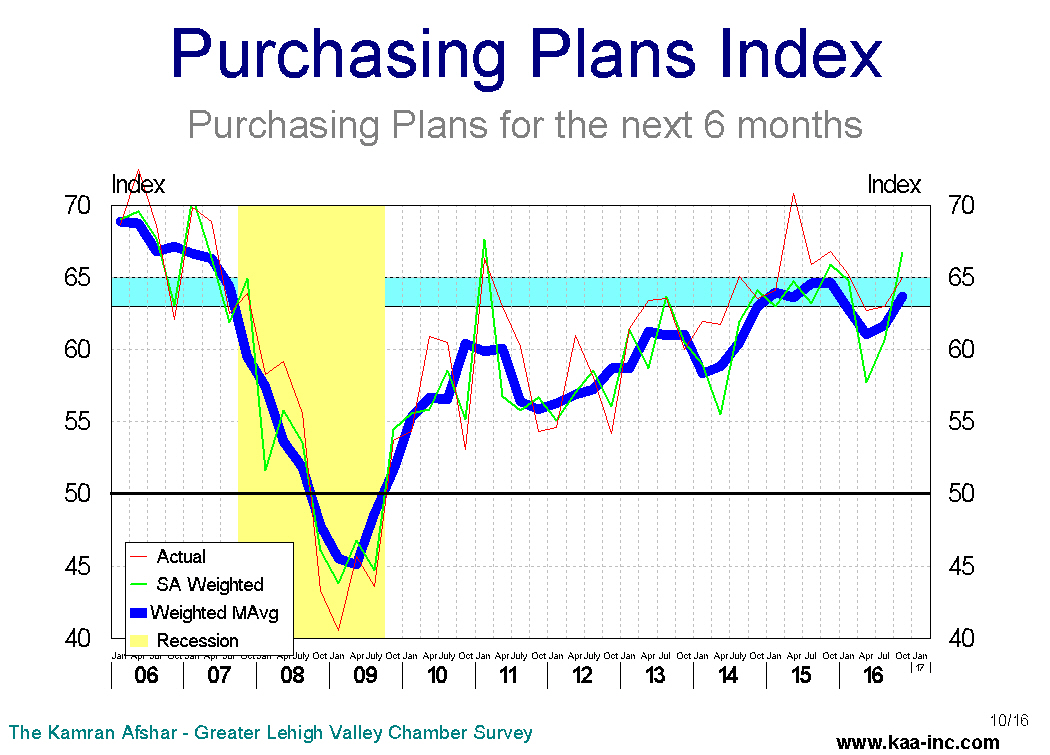
Hiring plans index for the next 6 months, is a shade higher than its July level, it has been very slowly moving up over the last 3 years and it is now at its highest level since April 2007, before the Great Recession. A third of local businesses are planning to hire more people, while 7% of them plan to lay off employees in the next 6 months. The layoff plans are now similar to what they were before the recession. 
The average business participating in the survey is planning to hire 1.1 new employees in the next 6 months. While this is a significant increase over what local businesses were planning to hire back in 2013, it is just slightly higher than their plans were in 2014 or 2015.
Businesses with 51 to 100 employees lead to quest for hiring more people in the next 6 months. Businesses with less than 6 employees, which constitute half of all businesses in the Valley, show the lowest desire to increase employment in the near future.
Lehigh Valley businesses have slightly reduced their pace of hiring over the last 12 months. This is normal in a recovery; when a recovery starts, employers need all kinds of employees and the pool of unemployed is deep and filled with variety of skills. As a recovery matures, with employers having filled their general needs, are then looking for more specific skill sets. However, as a recovery matures the pool of labor becomes much shallower with significantly less variety. That’s why right now in the Valley, a number of employers cannot find the particular skills they are looking for. And this is not limited to high tech jobs, welders as well as many other low tech vacancies are left unfilled due to lack of qualified applicants. This has contributed to the small drop in the number new hires. The average business participating in the survey hired 0.6 new employees over the last 6 months.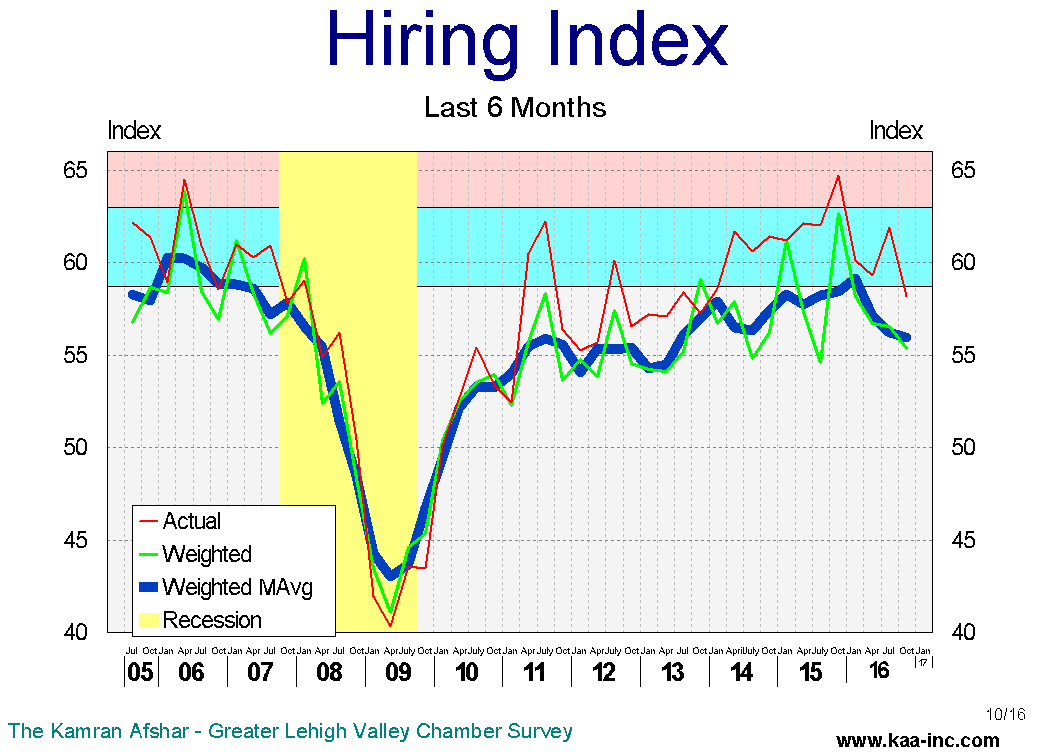
Companies with 11 to 20 employees led the group in new hires, and those with fewer than 6 employees were last on the list with a net zero addition to their employment ranks.
The index of actual purchasing has dropped 6% below its last year’s level. It should be noted that, overall, local businesses are increasing the amount of money they spent on purchases in the Valley. Over the last 6 months 36% of the local businesses increased their expenditures in the last 6 months while 16% reduced theirs, which means a net 20% of local business increased their expenditures over the last 6 months. The decline, is only relative, in October of 2015 a net 28% of local businesses increased their expenditures. And the decline, particularly in October was almost entirely due to the cutback in expenditures by companies which have between 51 to 100 employees. This has had a large impact since companies this size had been in the forefront of growth, particularly in the recent years. It should be noted that businesses with 51 to 100 employee participating in our survey are also the only category in the survey that has reported a decline in revenues over the last 6 months. 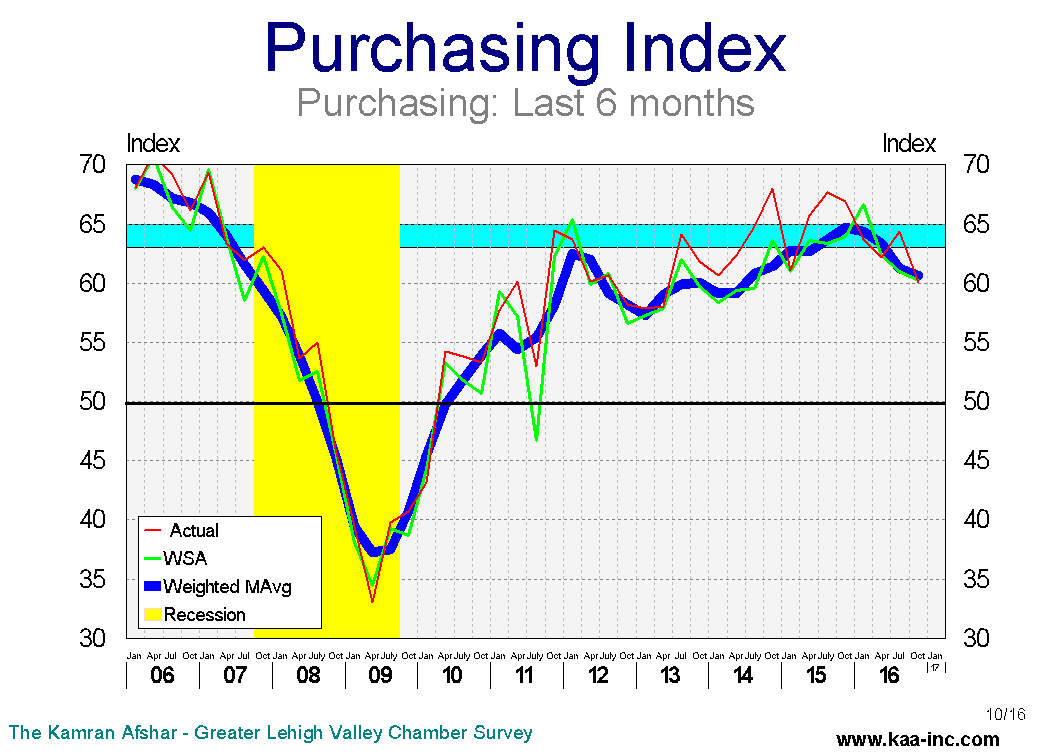
The average business participating in our survey increased its expenditures, by 3% in the last 6 months.
The index of actual revenues over the last 6 months has shown a small but steady decline this year. The October decline, not surprisingly, was entirely due to a drop in revenues of companies with between 51 to 100 employees. However, businesses with more than 100 employees reported the largest increase in their revenues in October. They were followed by those with 21 to 50 employees.
The index of expected future revenues, while oscillating widely, is continuing on a relatively flat trajectory. Businesses with 21 to 50 employees expecting to see the largest increase in the near future, with 69% of them expecting higher revenues while only 10% of them expect to see a drop. And interestingly enough, companies with 51 to 100 employees which were the only size companies who reported a drop in revenues over the last 6 months, overwhelmingly expect to see a significant increase in their revenues over the next 6 months. 
The October data shows an interesting split between the expectation of future and assessment of the past before the election. The split appears to be correlated with the level of uncertainty before the election. Business planning usually has very little to do with party politics. Business planning is about expected costs and projected revenues in the months to come. Both business costs and revenues are impacted by government policies. However, since businesses only know about the generalities of the new administration’s healthcare, tax, business and trade policies. Even those who enthusiastically welcome the change, don’t exactly know what are the new administration’s policies. In absence of specifics, time tables, congressional role, etc. business planning faces serious limitations. Similar to the period before the election, the uncertainty creates a wait and see attitude among businesses who will try to err on the side of caution. They have to wait until the new administration actually formulates its policies and then push them through either executive orders or the congress. If this process appears to be taking a long time, it will negatively impact the economic growth. On the other hand, if the new administration appears to be ahead of the game and formulates its policies rapidly, it may have a positive effect on economic growth. We will find out the answers to these questions in the next few months.
Lehigh Valley overall business sentiment slightly down since the beginning of the year
The Kamran Afshar- Greater Lehigh Valley Chamber of Commerce survey of Lehigh Valley businesses is done on a quarterly basis and collects around 700 observations per year. The Employment and Purchasing Index for the Lehigh Valley highlights the results of these surveys.
In July 2016 we conducted our 67th quarterly survey of these series, and according to the survey, business sentiment and the overall confidence in the local economy remained the same as in April, however, it is slightly lower than its January level. The index peaked back in October 2015.
.
In July, the index of plans for future purchases rose by a significant 5% above its April’s level. And while it is still lower than its January’s level, some of its April decline has been reversed.
Actual expenditures over the last 6 months, however, have been trending down since last October.
Hiring plans index for the next 6 months, is a shade higher than its April level, however, it has been trending at an almost constant level for the last year-and-a-half. And of more importance, this level is very close to the range which is historically associated with strong employment growth.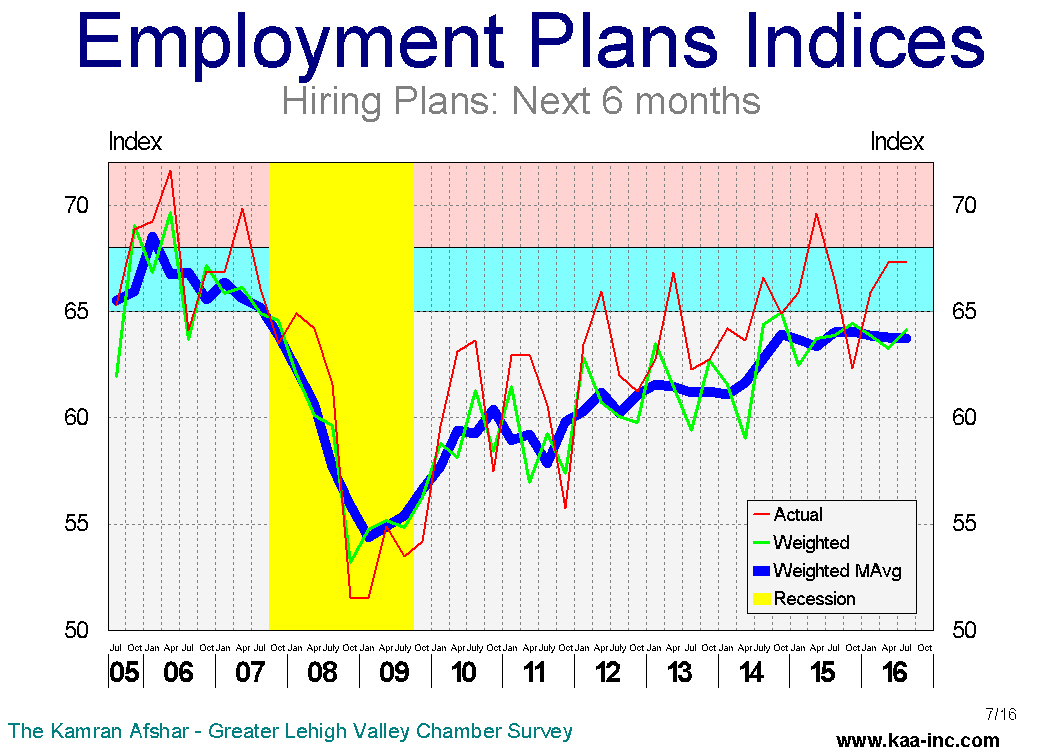 A third of local businesses are planning to hire more people, while only 5% of them plan to lay off employees in the next 6 months. The layoff plans are now similar to what they used to be before the recession.
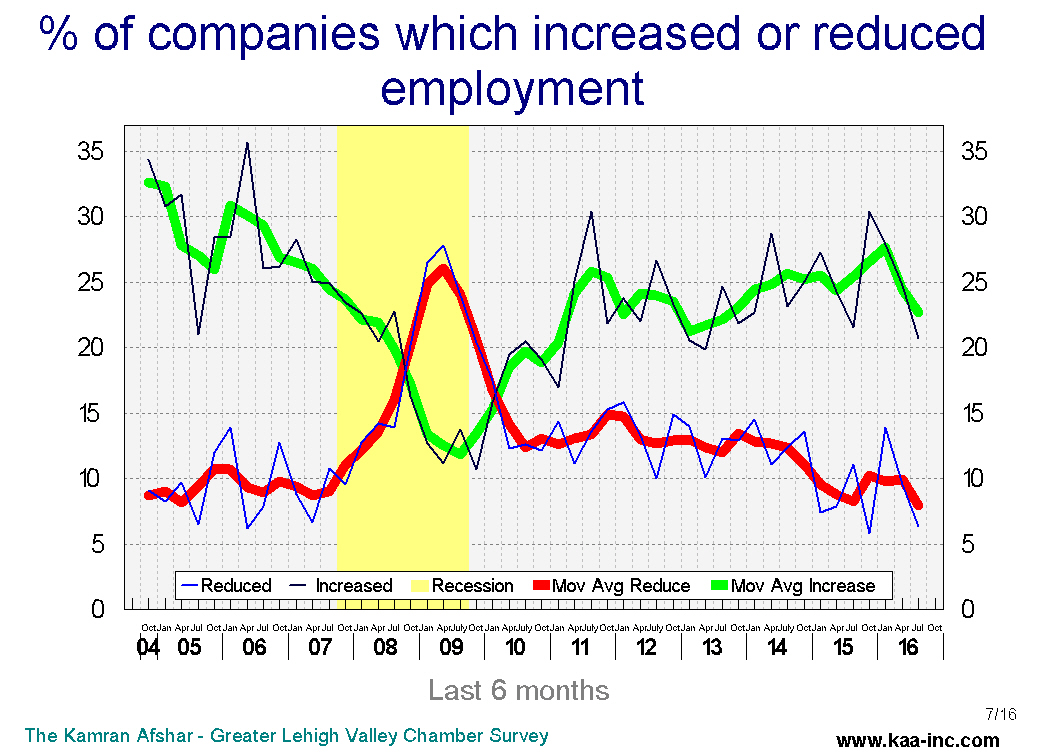
Businesses with more than 100 employees, followed by those with 21 to 50 employees are planning to hire more people in the next 6 months than others.
Similar to the future plans for hiring, the actual hiring index over the last 6 months was almost the same as its April level, but unlike the future hiring plans, the actual hiring index has dropped below its January level.
In July businesses with more than 100 employees reported hiring more people in the last 6 months than the others.
The index of expected revenues is continuing its rebound from its January lows and it is running at its highest level over the last 5 quarters.
The index of actual revenues, rose above its April level, however, it is still running below its January 2016 level.
The overall confidence in the local economy has dropped since last October and some of this decline can be attributed particularly to the increase in the level of uncertainty generated by this election process. We have observed declines in business confidence in previous general elections over the last 16 years. The Valley’s economy is expected to suffer some anxiety over the next few months as election campaigns further ratchet up their activities. However, since our labor market is running close to where it was during the tight labor markets of 1999-2000 and 2004-05 and an increasing number of businesses are reporting more unfilled job openings, it appears that we would weather this election with minimal, if any negative economic impact locally