


Category Archives: KAA Blog
Lehigh Valley overall business sentiment slightly down since the beginning of the year
The Kamran Afshar- Greater Lehigh Valley Chamber of Commerce survey of Lehigh Valley businesses is done on a quarterly basis and collects around 700 observations per year. The Employment and Purchasing Index for the Lehigh Valley highlights the results of these surveys.
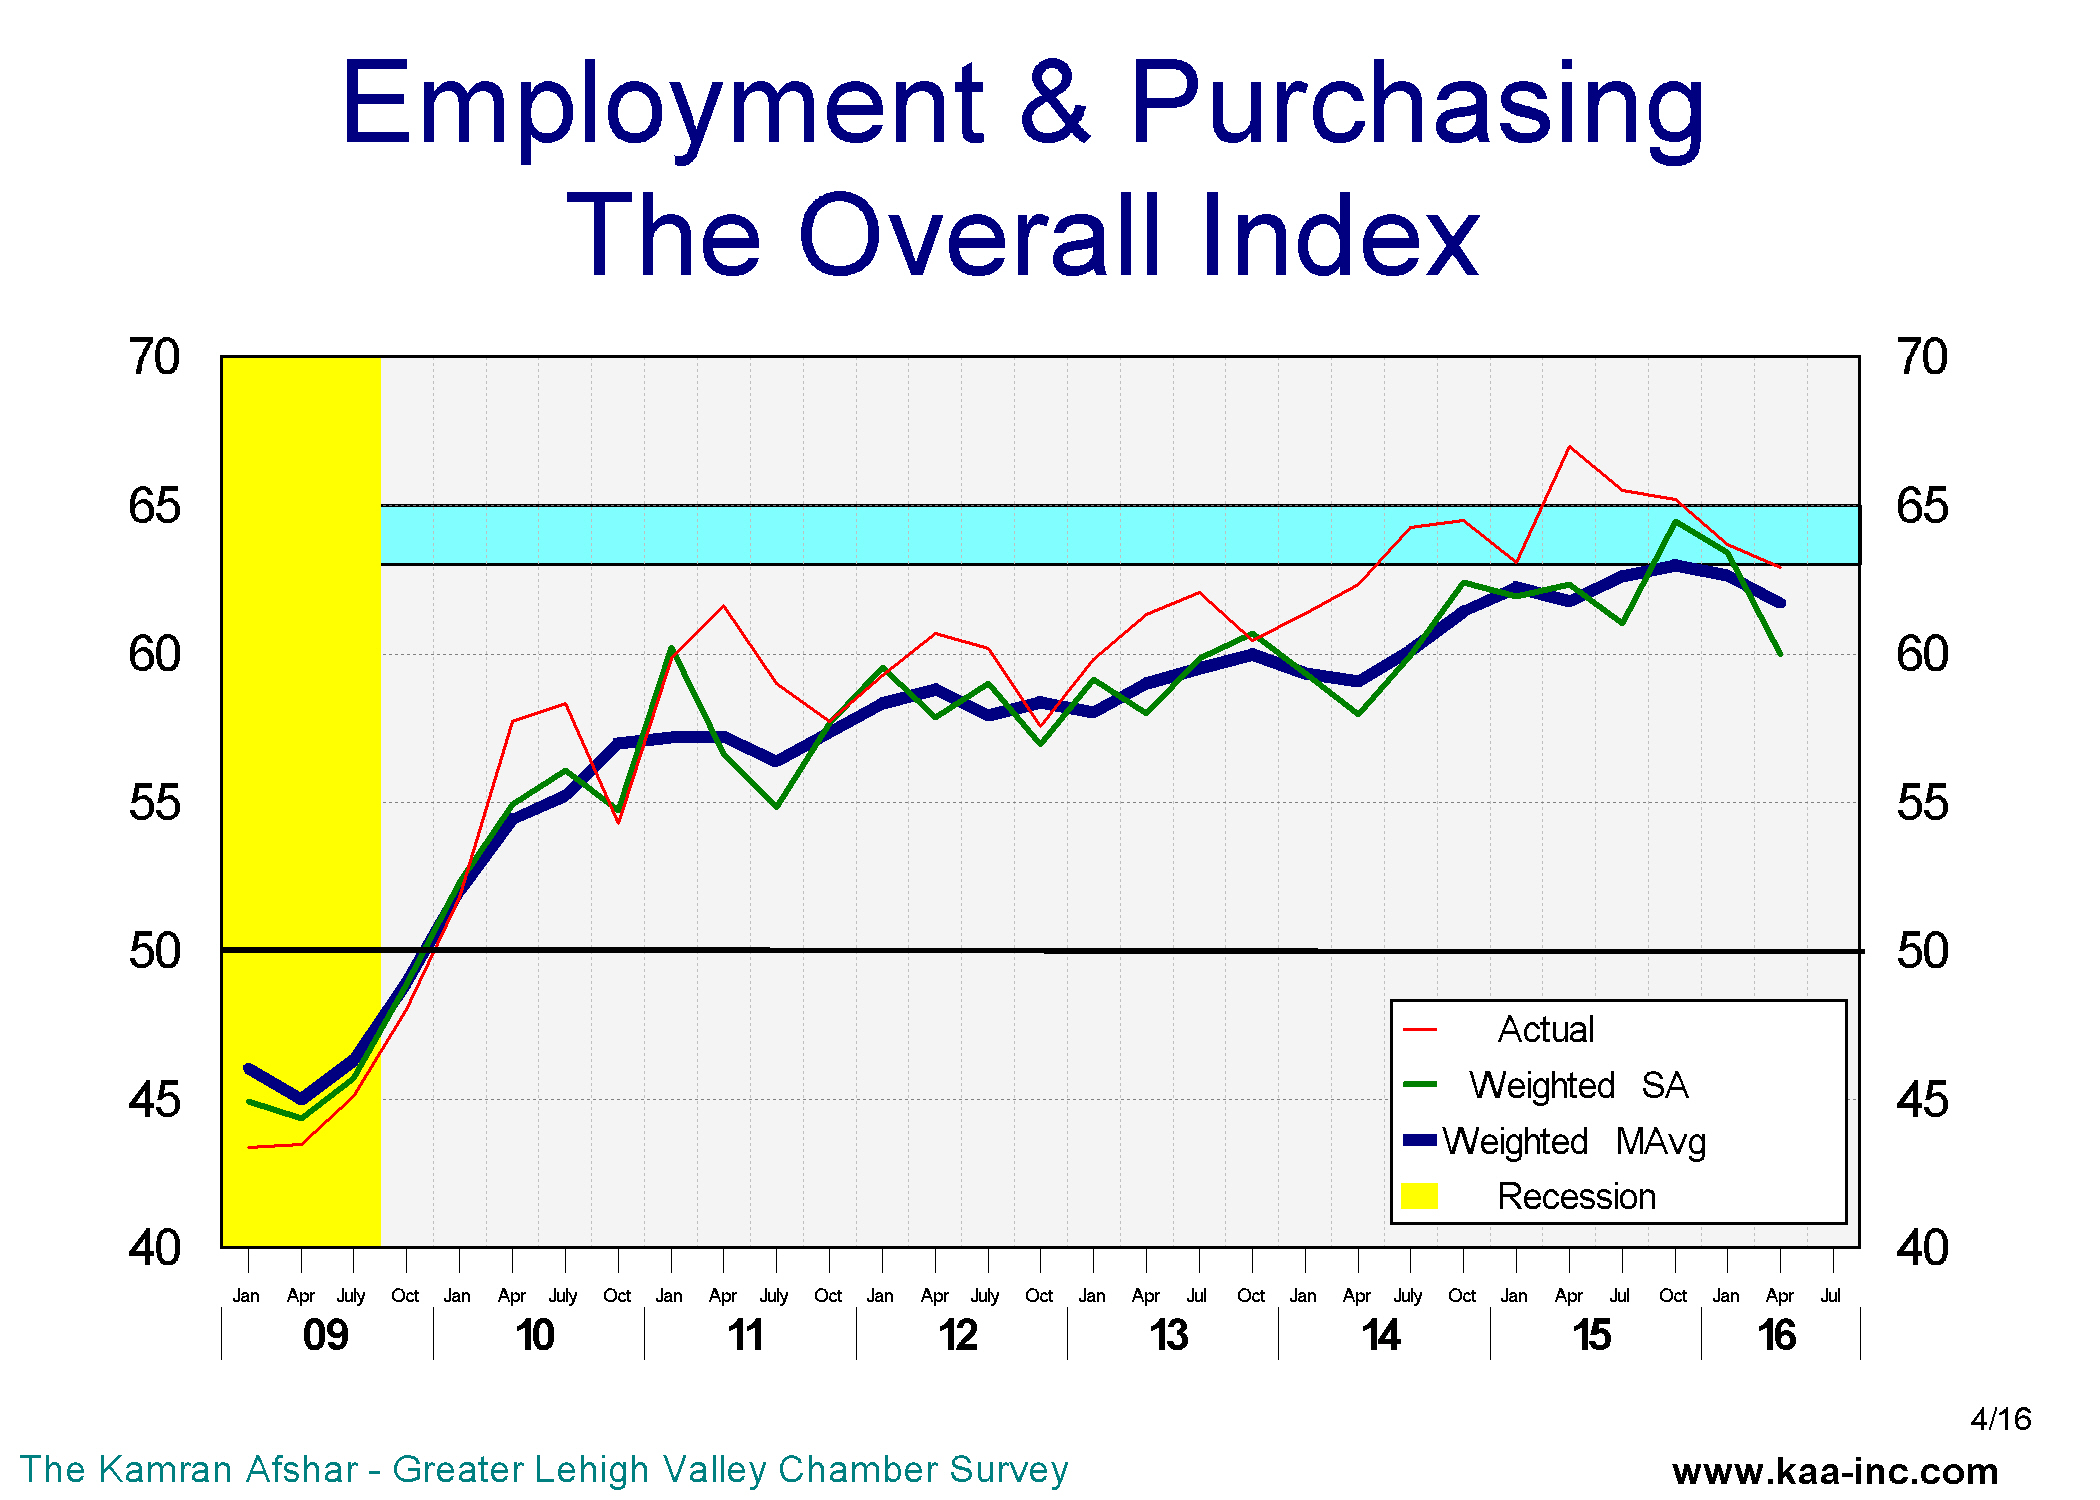
In July 2016 we conducted our 67th quarterly survey of these series, and according to the survey, business sentiment and the overall confidence in the local economy remained the same as in April, however, it is slightly lower than its January level. The index peaked back in October 2015.
.
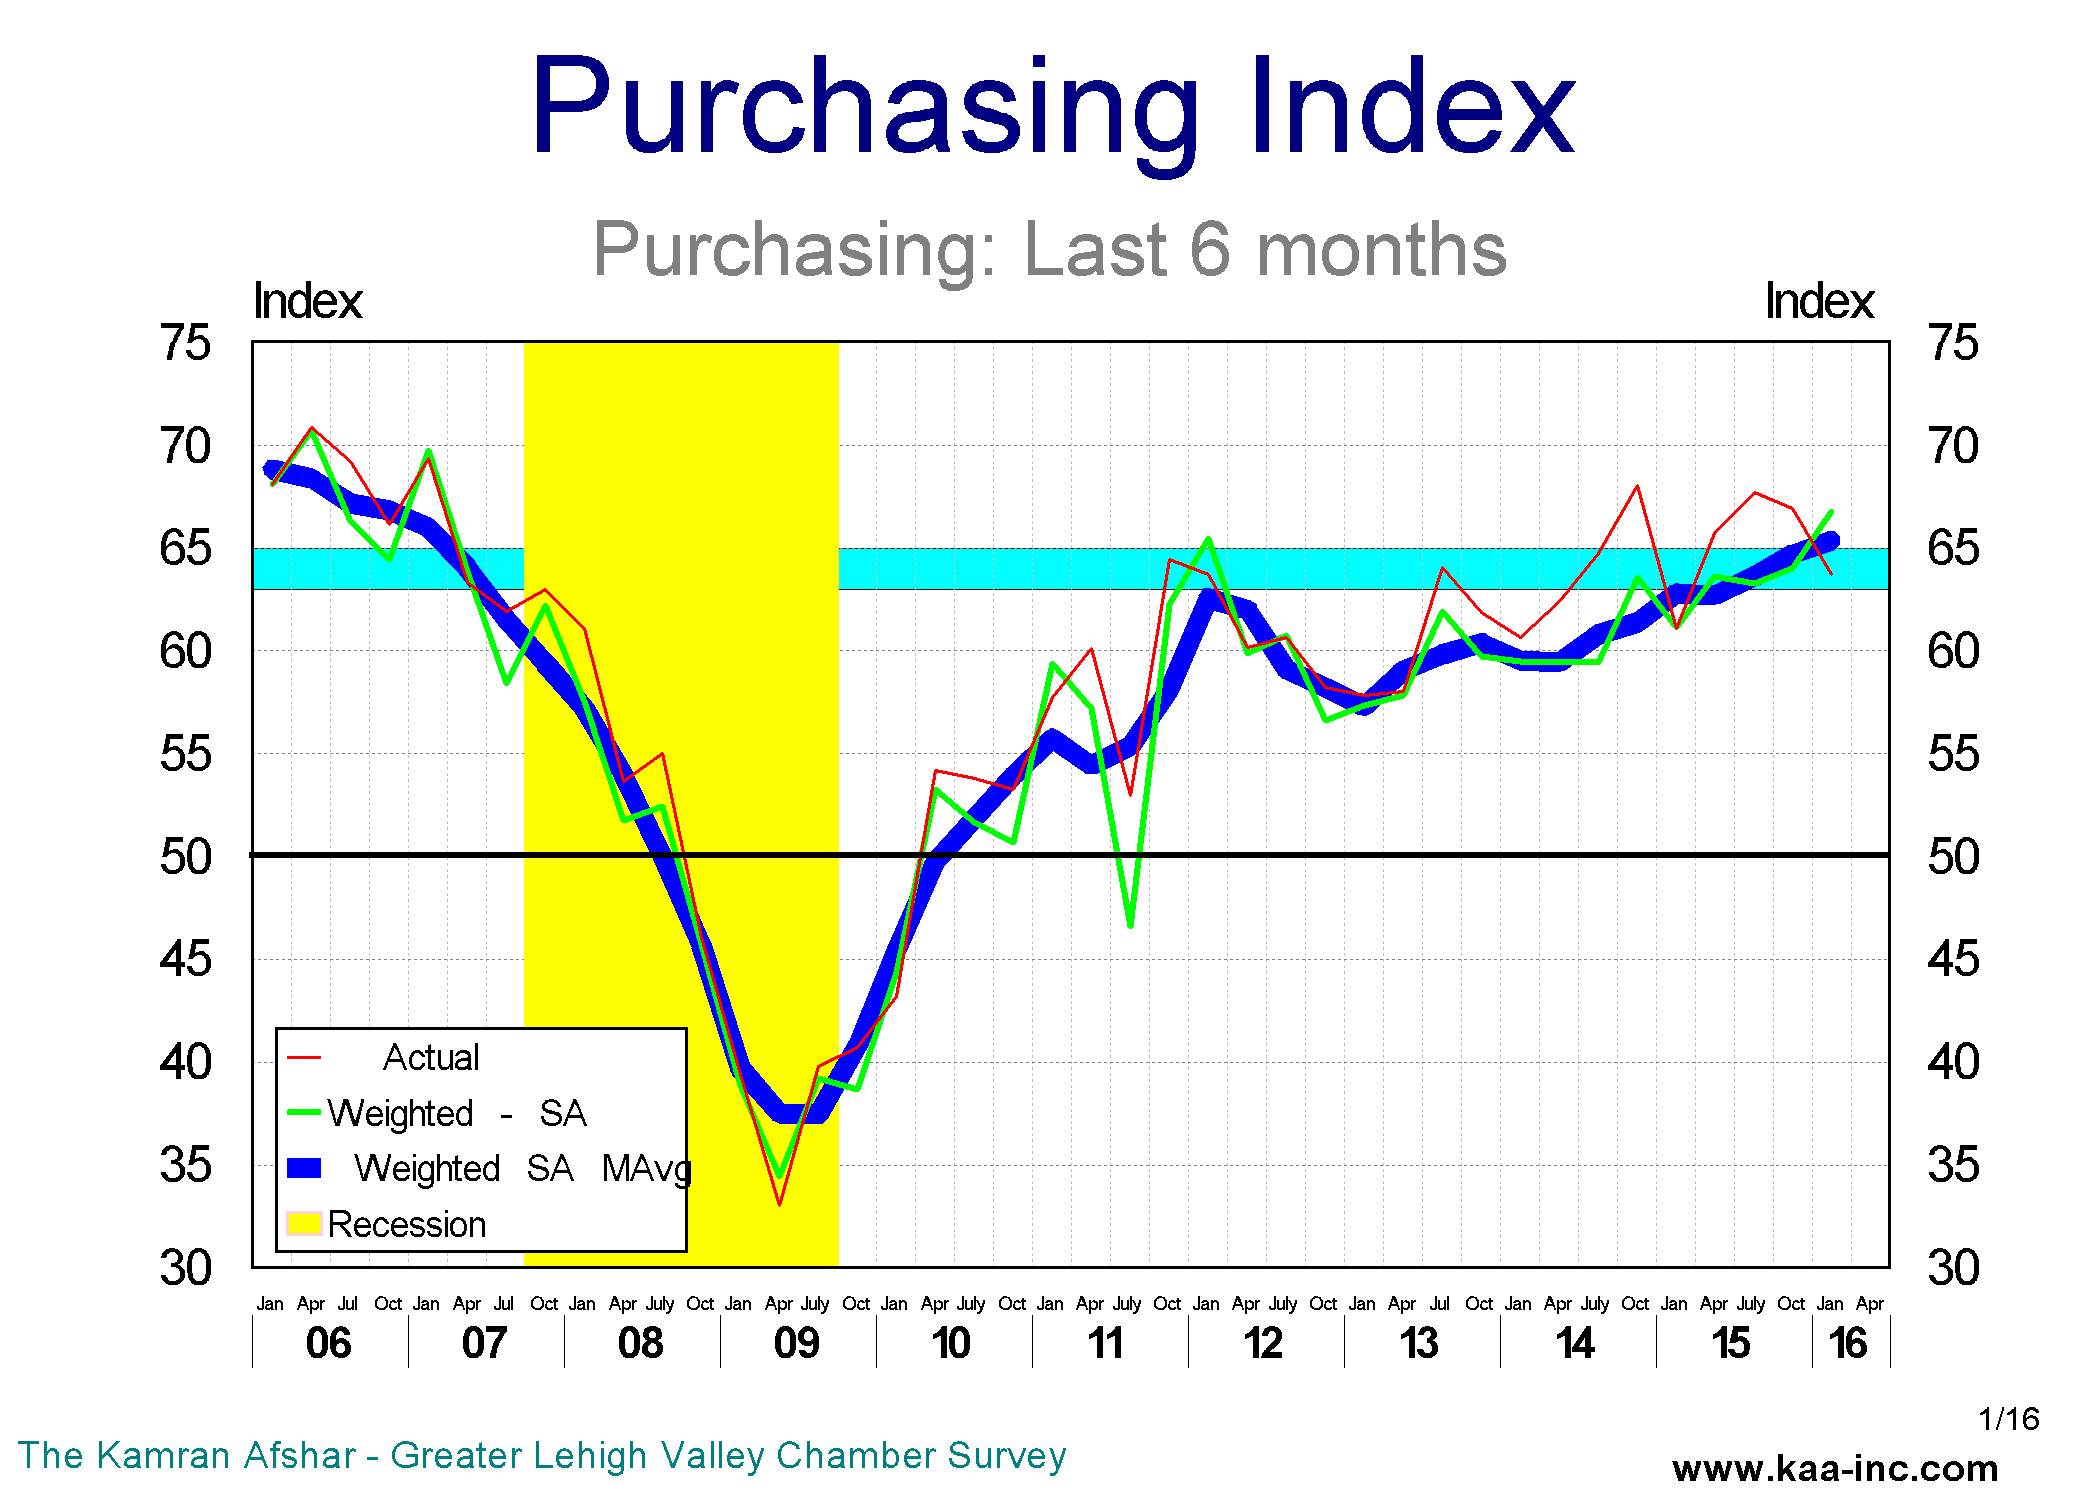
In July, the index of plans for future purchases rose by a significant 5% above its April’s level. And while it is still lower than its January’s level, some of its April decline has been reversed.
Actual expenditures over the last 6 months, however, have been trending down since last October.
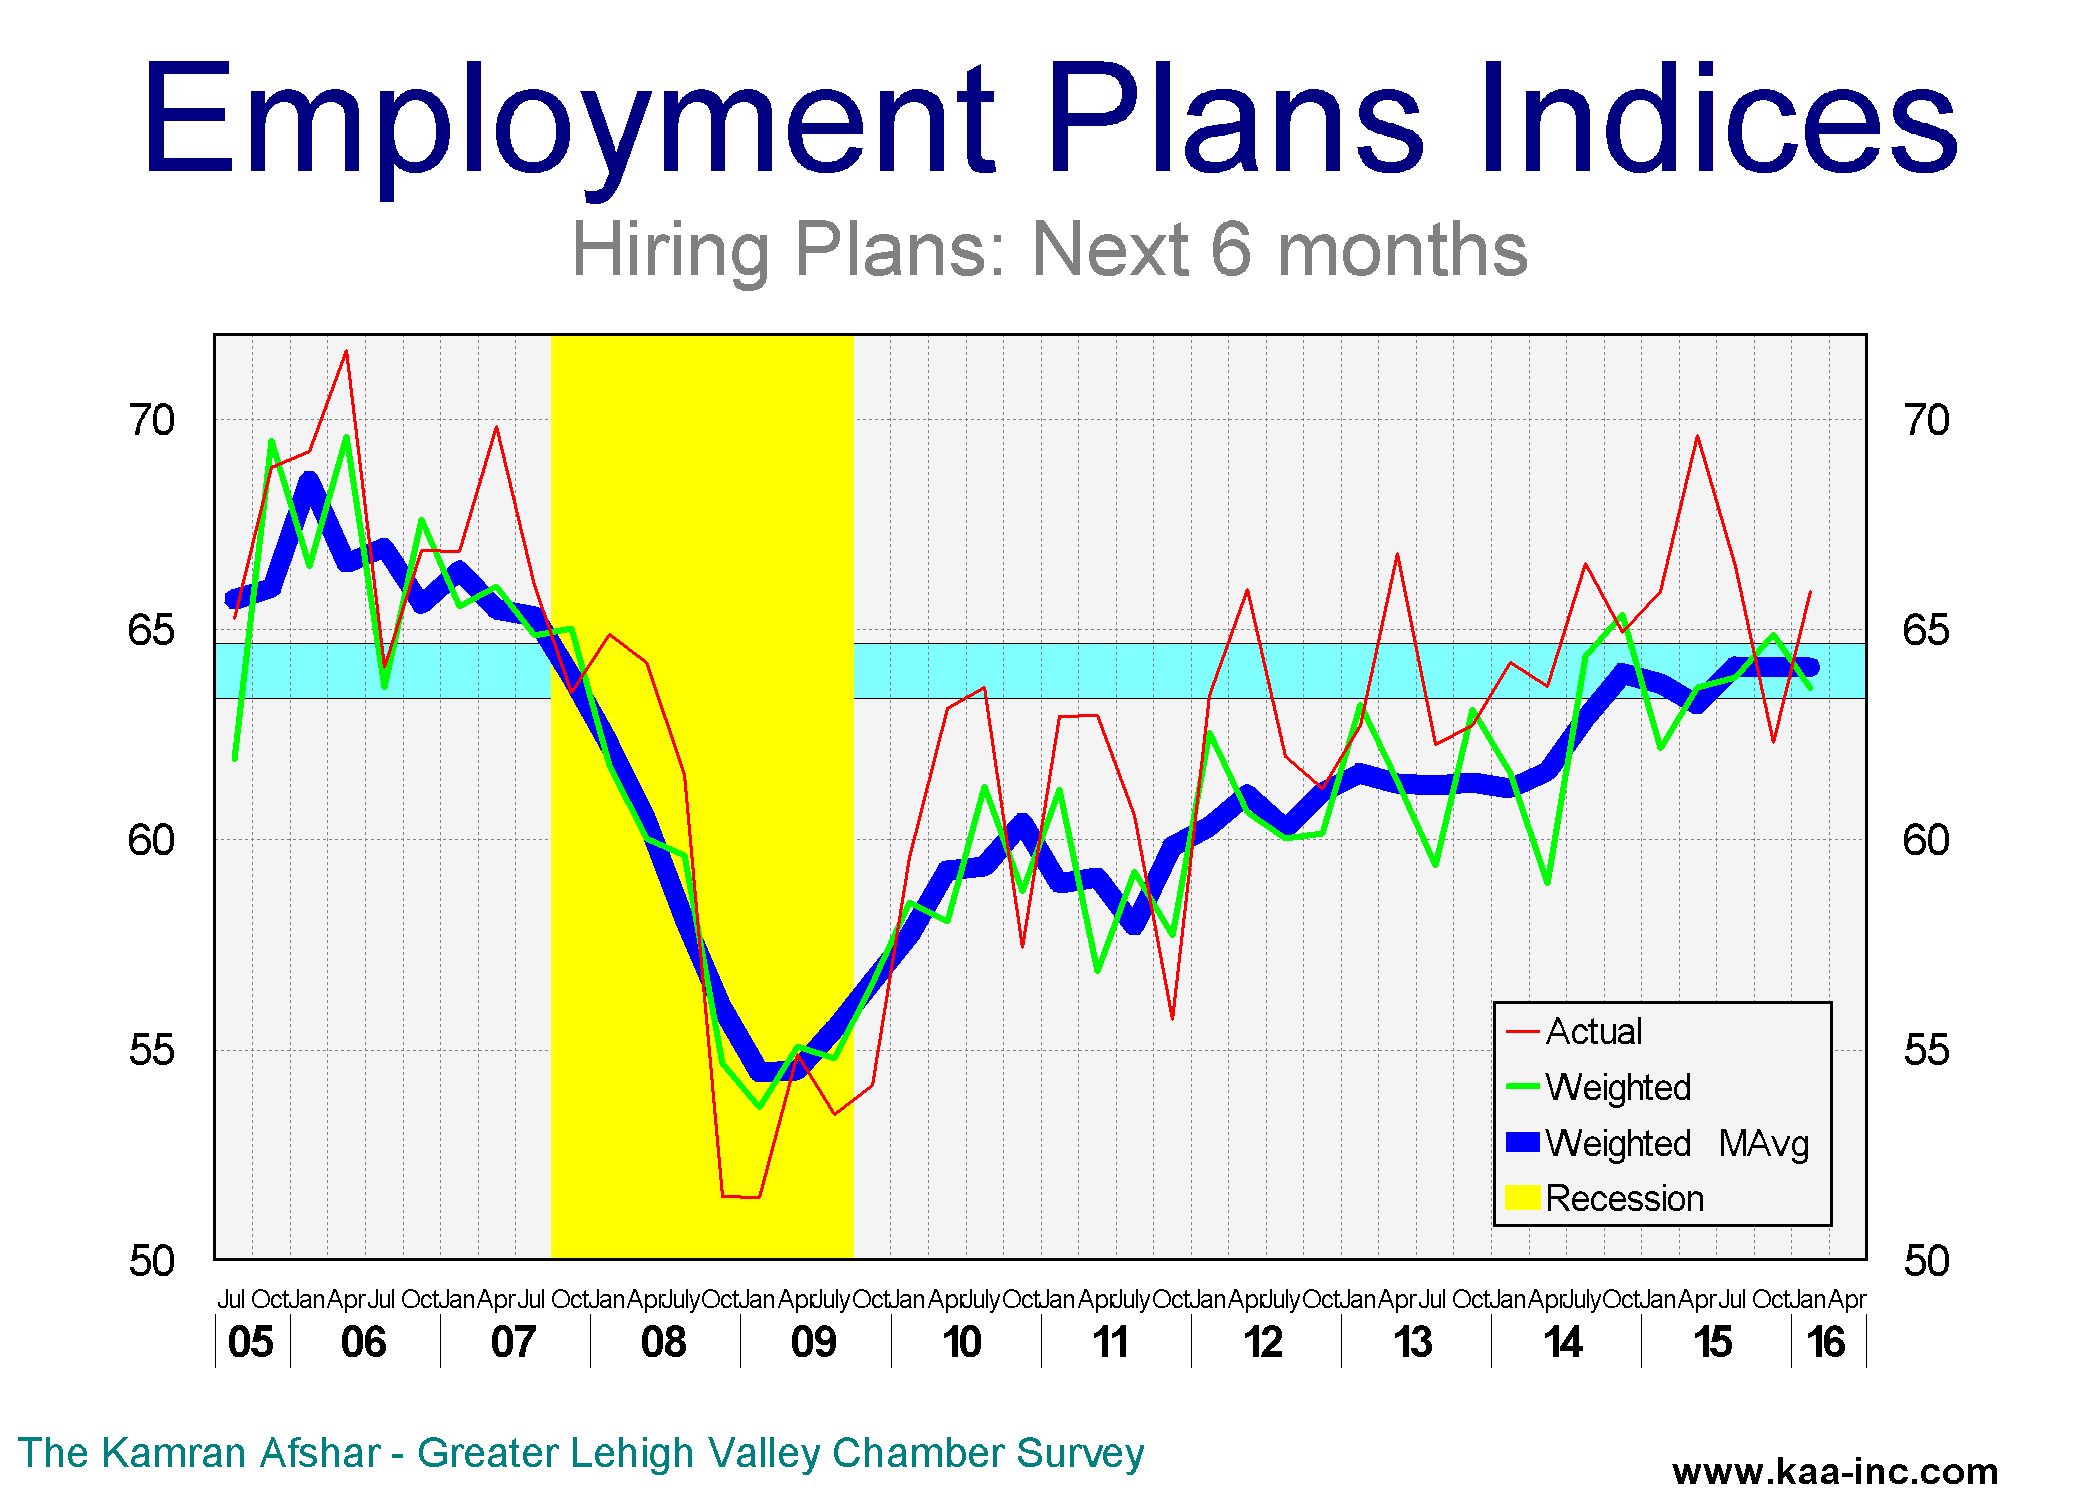
Hiring plans index for the next 6 months, is a shade higher than its April level, however, it has been trending at an almost constant level for the last year-and-a-half. And of more importance, this level is very close to the range which is historically associated with strong employment growth.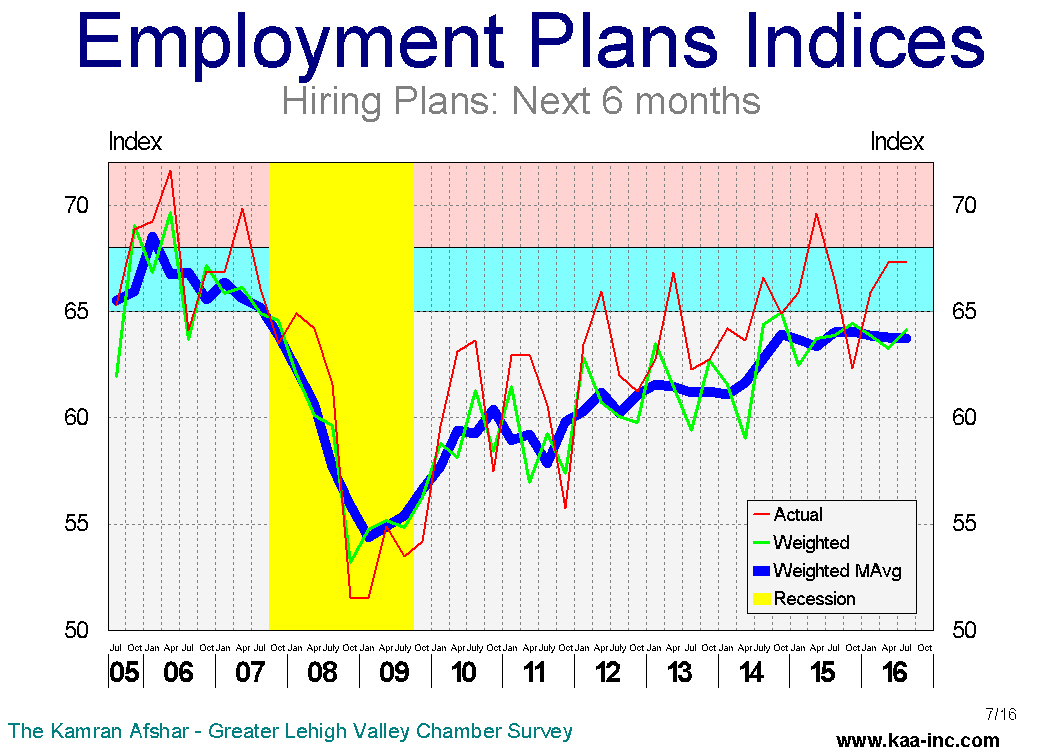 A third of local businesses are planning to hire more people, while only 5% of them plan to lay off employees in the next 6 months. The layoff plans are now similar to what they used to be before the recession.
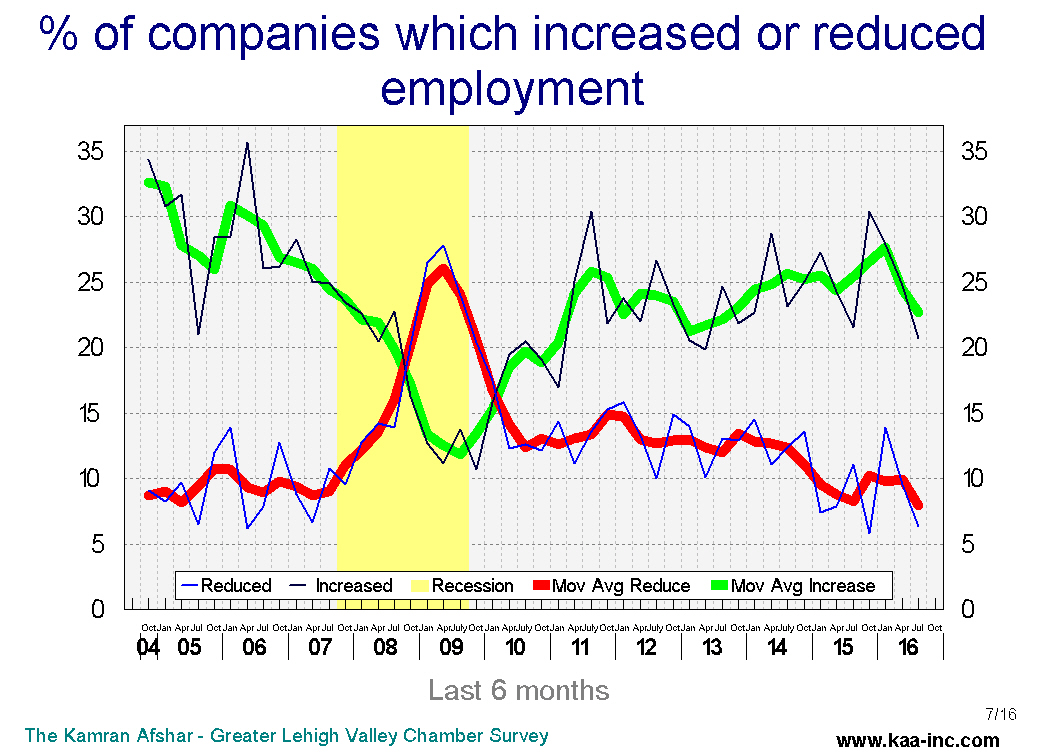
Businesses with more than 100 employees, followed by those with 21 to 50 employees are planning to hire more people in the next 6 months than others.
Similar to the future plans for hiring, the actual hiring index over the last 6 months was almost the same as its April level, but unlike the future hiring plans, the actual hiring index has dropped below its January level.
In July businesses with more than 100 employees reported hiring more people in the last 6 months than the others.
The index of expected revenues is continuing its rebound from its January lows and it is running at its highest level over the last 5 quarters.
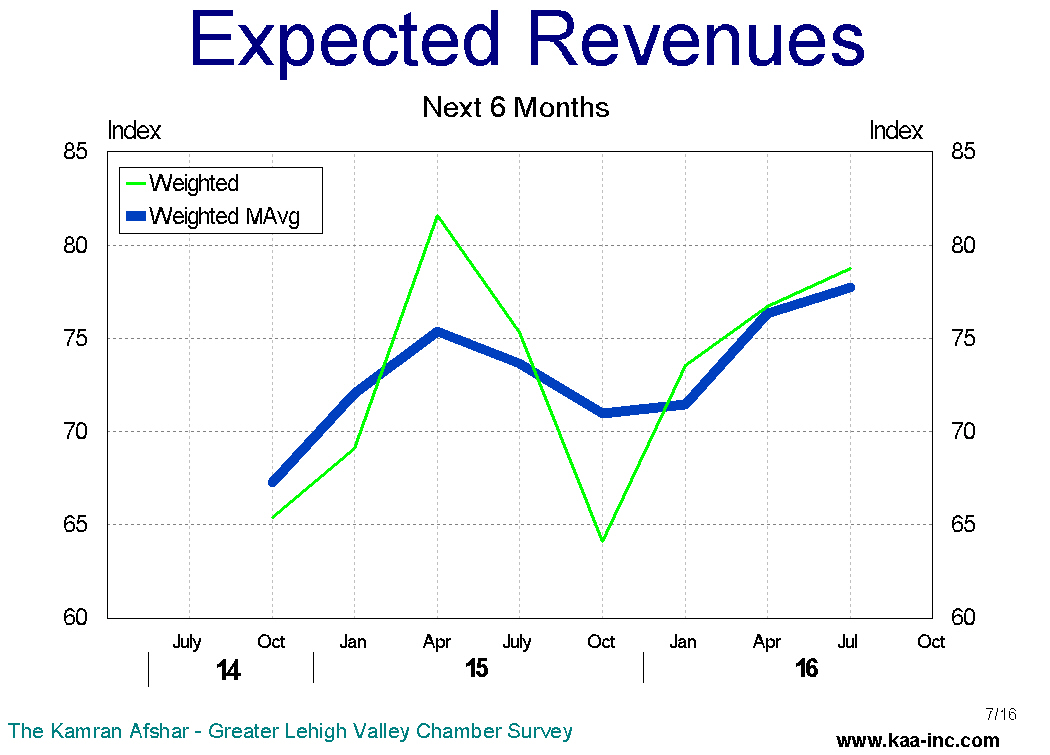
The index of actual revenues, rose above its April level, however, it is still running below its January 2016 level.
The overall confidence in the local economy has dropped since last October and some of this decline can be attributed particularly to the increase in the level of uncertainty generated by this election process. We have observed declines in business confidence in previous general elections over the last 16 years. The Valley’s economy is expected to suffer some anxiety over the next few months as election campaigns further ratchet up their activities. However, since our labor market is running close to where it was during the tight labor markets of 1999-2000 and 2004-05 and an increasing number of businesses are reporting more unfilled job openings, it appears that we would weather this election with minimal, if any negative economic impact locally
Does Anybody still remember what we used to call inflation, what happened to it?
Before the Great Recession, inflation was rising at a pretty healthy rate, reaching as high as 5.6%, however, the recession wiped out that inflation alongside 8.7 million payroll jobs, a booming housing market, more than 500 commercial banks as well as thousands of other businesses.
!
The FED was not all that active during the months leading to the Great Recession. They basically disregarded a number of alarms raised by relevant banking data. At the time the solution appeared to be changing the definition or down grading the importance of the indicators which raised alarms about the liquidity of the US banking system.
The FED eventually discovered that the alarms were for real and switching them off did not remove the problem, and to its credit, it then went to town on raising the money supply and helping many banks fend off bankruptcy. The FED continued pushing high powered money into the economy way after the official end of the recession; by the middle of 2014 the monetary base was almost 5 times its pre-recessionary level.

The rapid increase in the monetary base did ring all the inflation alarm bells, and this time round everybody paid attention, however, no inflation appeared. Many monetarists of the 1970s and 80s are turning in their graves, as they theorized, affirmed and predicted that large increases in the money supply, and by which they meant things like 20% or 30%, will be translated into hyperinflation in a relatively short period of time. And of course the German hyperinflation of the early 1920s was a clear proof of the concept. But inflation didn’t come! At 1.0% we are much closer to deflation than anything resembling what used to be called inflation.
What gives? The Great Recession does. The economy was so badly mauled and battered that the velocity of money (that is the rate of circulation of money) crashed, like many other things in the economy, and while a lot more money was being pushed into the system, since it was circulating at a slower and slower pace, it did not cause the expected inflation, and it appears that its is not going to do so anytime soon. On top of that, the crash of oil prices over the last couple of years which was accompanied with declines in the prices of many other raw materials have almost locked the inflation rate in low gear.
As the recovery started to move ahead faster and unemployment rate dropped we all expected the velocity of money to rise, as it did in every recovery until now. This time round it didn’t, actually velocity of money recorded a very small increase after the start of the recovery, and then it again started to decline, albeit at a much more orderly pace than before. And while there are a variety of explanation for the continuing decline in rate at which money circulates in the economy, including the wider use of electronic money, the fact is that the velocity of money is continuing to drop.
Despite of having no inflation, the FED is slowly reducing the monetary base, just in-case all of this discussion about the new normal is a fancy way for economists to say, we really don’t understand why inflation is this low!
Lehigh Valley is about to enter its fourth tight labor market in 30 years
The number of initial unemployment claims, which shows the size of the newly unemployed in the Lehigh Valley is trending at 14% below its last year’s level as of April 2016. This indicator’s long-term trend has been in the range which is historically associated with tight labor market since last November. The last time this indicator dropped below its normal range was before the tight labor market of 2004. If this trend continues, this will be the fourth time in the last 30 years that initial unemployment claims has dropped and stayed below its normal range. The previous three were; 1987, 1998 and 2004. And in all these occasions when the number of initial unemployment claims dropped and stayed below its normal range, a tight labor market ensued.

During the worst days of the Great Recession the number of initial unemployment claims exceeded 8,000. It should be noted that the Valley’s labor market went from tight in October 2006, to flooded by March 2009. This caused a rapid increase in the number of newly unemployed in a short period of time, by far the worst labor market in the last 30 years.
The continuing unemployment claims, shows the number of people who are receiving unemployment checks due to loss of job in the previous months. This is a very good indicator of the locally available labor pool.
Continuing unemployment claims also rose rapidly as the unemployment rate sky rocketed in the Valley during the Great Recession. This index rose to around 90,000 which roughly translates to 40,000 people receiving unemployment checks by March 2009.
The Index of continuing unemployment claims is also trending well below its last year’s level. Roughly translating the index shows around 12,000 people received unemployment checks in April. During the same period there were more than 23,000 people in the Valley who were actively looking for a job, which means that there were also another 12,000 people looking for work in April without the benefit of unemployment checks.
Since the end of 2015, the Valley’s labor force has increased by 3,600 new job seekers, that is in 4 months, the local labor force’s expansion was equivalent to it annual growth in the years past. And this is good news since it indicates that more of the discouraged workers are coming back to the labor force.
While unemployment rate rose by close to one percentage point since last December, almost the entire increase in this rate was due to the expansion of the labor force.
Being a job seeker is rarely fun, however, if the current trends continue, this would be one of the best times in the last 30 years to be looking for a job. As we expect to see a lot more new entrants to the labor market as well as more wage increases as the Valley enters its fourth tight labor maker in 30 years.
Consumer sentiment rose sharply due to further increases in earnings
As of the last week of May 2016, gasoline prices were hovering around $2.35, still around 20% lower than their last year’s level at the same time, but clearly much higher than the $1.90s which was available back in February. And the DJIA is still above its last year’s close.
Both the gasoline prices and the stock market influence consumer sentiment and how consumers feel directly impacts the economy, considering that more than two-thirds of our economy is consumer expenditures.
A brief look at the University of Michigan’s consumer sentiment index shows that it ran between 90 and 95 during the 2003-2004 prosperous economic period, then it started to dropped about a year before the start of the Great Recession. While the economy was still humming during the first 3 quarters of 2007, and the DJIA was rose by 12%, the consumer sentiment index dropped by 13.5 points, by the end of 2007, the index had plunged by 20%. During the recession the index further crashed all the way down to a low of 55.
Interestingly enough, some 6 months before the official end of the recession, consumer sentiment index started to climb. Rising to 68 by the official end of the recession.
Consumer sentiment index is clearly one of the strong leading indicators of the economic cycles.
The index rose sharply in May to 94.7, its second highest level in last 12 months. the long-range trend of the index has been well within the range that prevailed during the prosperous economic times of the past since the middle of 2014..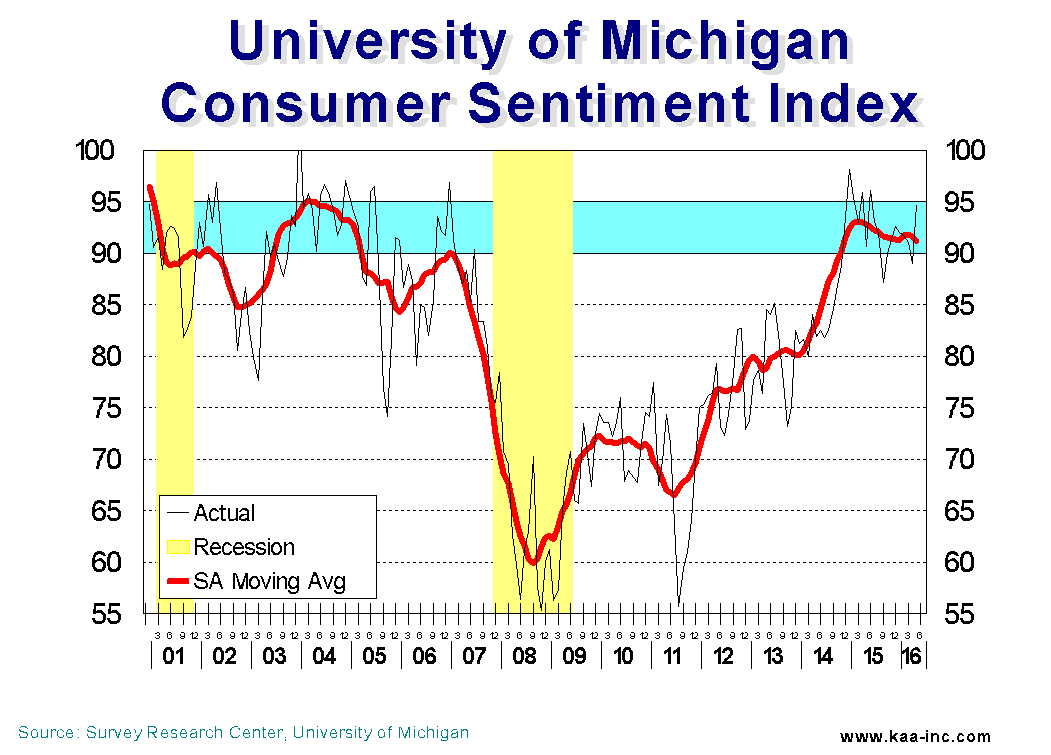
The sharp rise in the May’s consumer sentiment index was due to improving job market as well as higher income experienced by consumers. They also enjoyed the low interest and inflation environment as well as an improved job market outlook. While income gains were recorded across the board, the largest gains were among lower income and younger households. The May data recorded the highest share of households since 2000 who said their earnings had recently grown. And most interesting is consumers’ anticipation of gain in their home values during the year ahead which is at its highest level in almost a decade.
There is however, a growing sense of uncertainty, according to the University of Michigan’s survey, as to the shape of government’s economic policies under a new president. This will temper consumer spending
Oil market glut is continuing to expand, surprisingly, so is the price of oil
Forecasting oil prices with any reasonable accuracy appears to be beyond the scientific abilities of many economists. At times it appears that this task is more in the realm of art rather than the science of forecasting.
The basic methodology of any price analysis is to brake the market into its primary components, supply and demand. As I use to tell my students, economics is an easy subject.
Starting with supply of oil; during the first half of 2014 and before oil prices crashed, global supply of oil was hovering at around 92 million barrels per day, about 0.6 million barrels of daily over supply. Despite of that oil prices rose by about 5% during the same period. During the second half of 2014, oil production increased by more than 2 million barrels a day, increasing the daily surplus to 1.1 million barrels. This resulted in a sizeable increase in oil inventories accompanied with a 44% drop in the price of oil.
Cushing Oklahoma is a vital transshipment and storage facility in the US, its storage reserves rose by 45% during the second half of 2014.
Thus far the basic tenets of economics have worked, as supply increased faster than demand, prices dropped and inventories rose. Didn’t I say economics is easy.
Well, here is where we have to make some minor adjustments to the simple pricing model to explain why a 2% increase in production has caused a 44% drop in prices.
In reality the pricing models are more complicated than what I initially alluded to, we have to allow for a number of variables, from the simple ones like supply and demand, to some more complex ones like expectations of the future. And then of course there is an array of other variables, like the asymmetric production cost variables, that has to be considered. Well I guess some of my students may have had a point, economics is not all that easy. 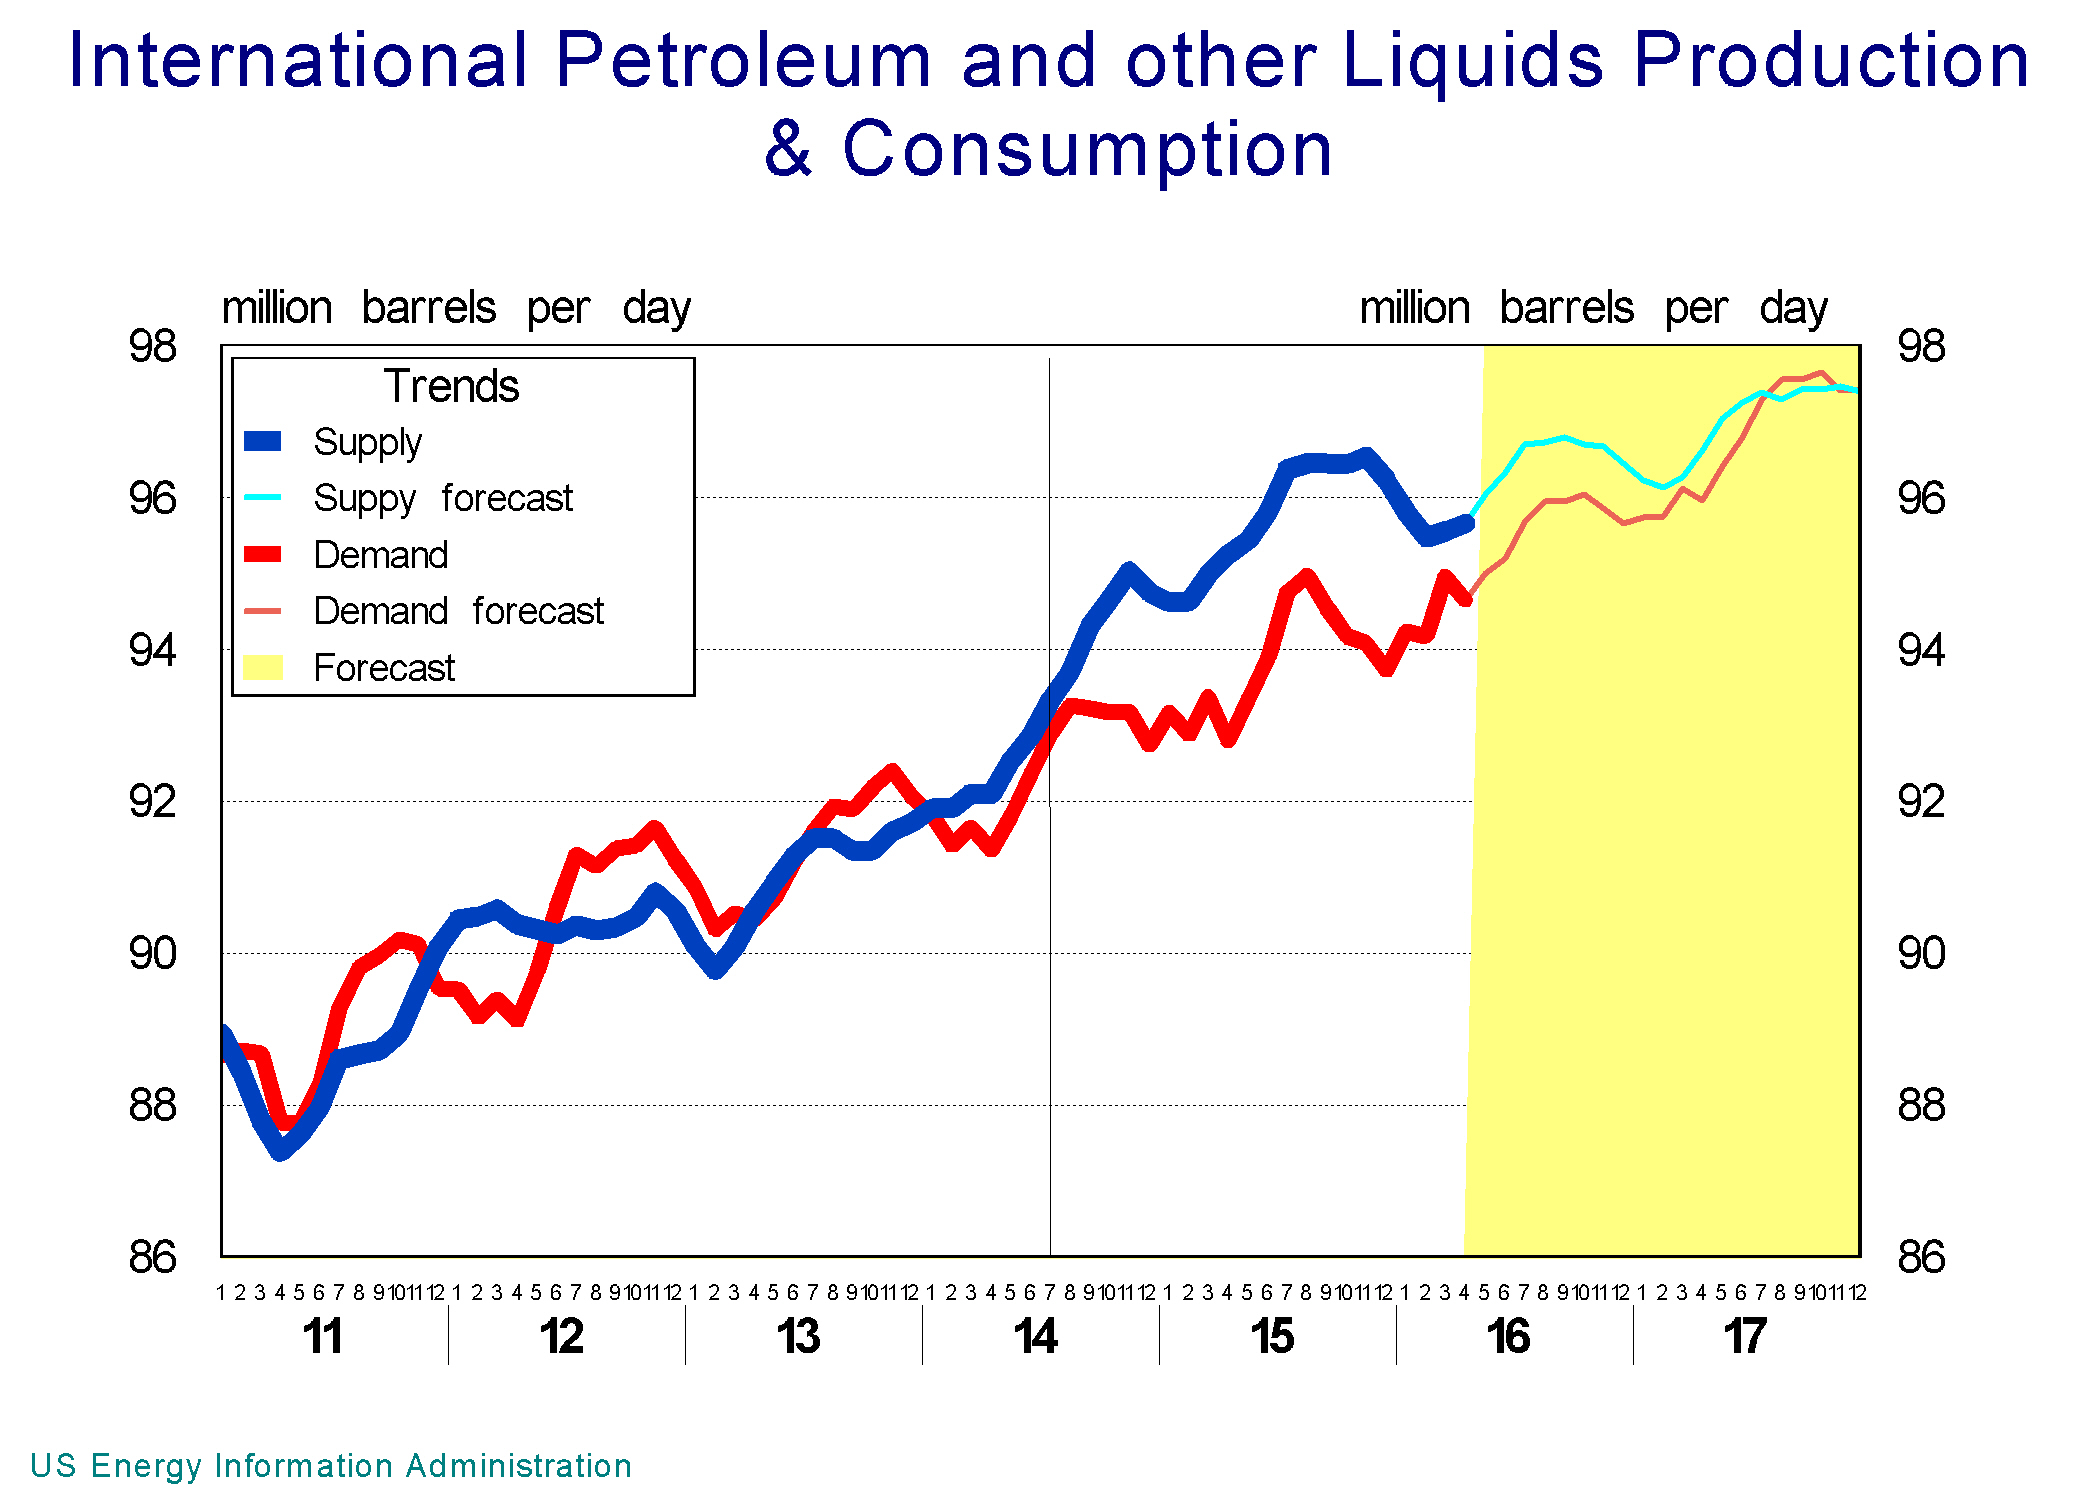
As of the second week of May, oil prices have shown an increase of 31% for the year, despite the fact that during the same period there was an average of 1.4 million barrels of daily surplus added to the market, further inflating oil storage inventories.
Cushing reserves are at more than triple the level they were when oil prices started to drop in 2014, total oil supplies have risen to an estimated 96 million barrels per day which is projected to create 1 million barrels of daily surplus for the balance of the year according to the US Energy Information Administration (EIA). However, and in the same publication EIA also forecasts a significant 10% increase in price of oil by end of the year.
Interestingly enough, as of this writing, the price of oil has already surpassed the EIA’s forecast despite the historically high and continually expanding sea of oil storage inventories.
The index of business sentiment in the Lehigh Valley dropped for the second time in a row in April
The Kamran Afshar- Greater Lehigh Valley Chamber of Commerce survey of Lehigh Valley businesses is done on a quarterly basis and collects around 800 observations per year. The Employment and Purchasing Index for the Lehigh Valley highlights the results of these surveys.
In April 2016 we conducted our 66th quarterly survey, and according to the survey, business sentiment in the Valley picked last October and has been dropping since then.
The largest decline among the indicators in the model was in the index of purchasing plans for the next 6 months. It dropped 11% below its January level, falling all the way back to where it was in 2014. 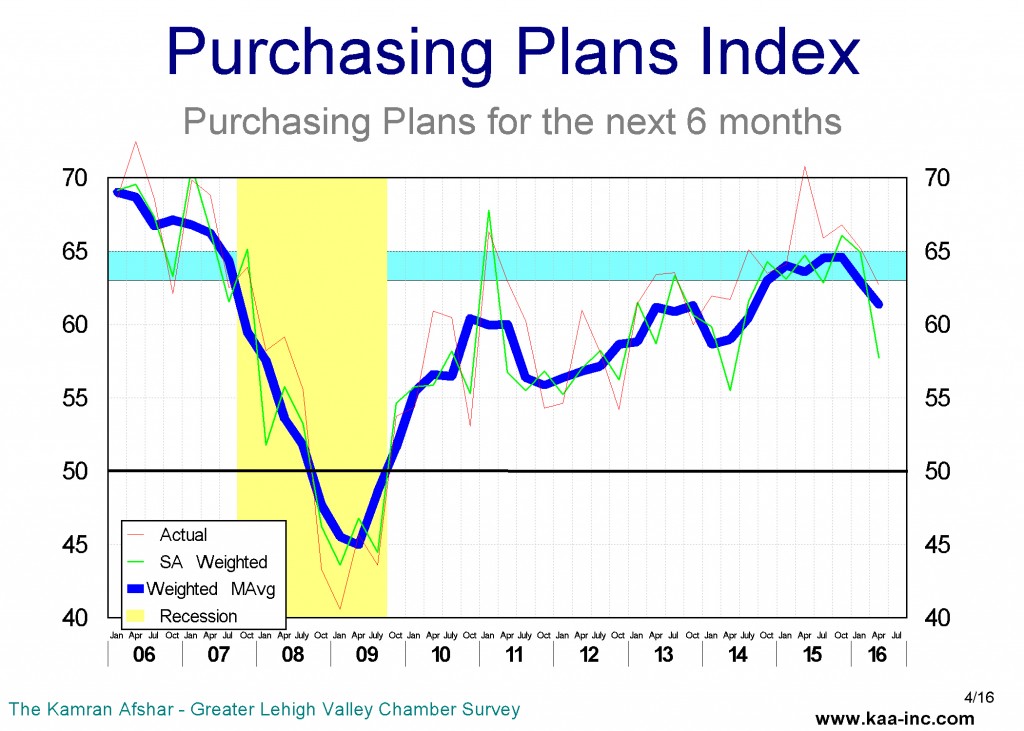
While majority of the participants in the survey reduced their future expenditures plans, businesses with 11 to 20 and those with 21 to 50 employees actually increased theirs.
Actual expenditures over the last 6 months dropped by almost 7% below its January level. This is a large drop. And this was almost across the board with the exception of businesses with 11 to 20 employees which increased their expenditure level compared to January.
The index of Hiring recorded a slight drop below its January level. Average business participating in the survey increased their employment level by 0.4 employees, a significant drop from last October when the average was 1.1 new employees. A quarter of the participants in the April survey reported net additions to their employment level, while 10% reported layoffs, a slight up-tick in the layoff trend.
Hiring plans index for the next 6 months, is the only indicator in the model that dropped by less than 1% and is in statistical tie with its January level. This indicator has dropped slightly over the last 6 months, however, it is still in the positive range..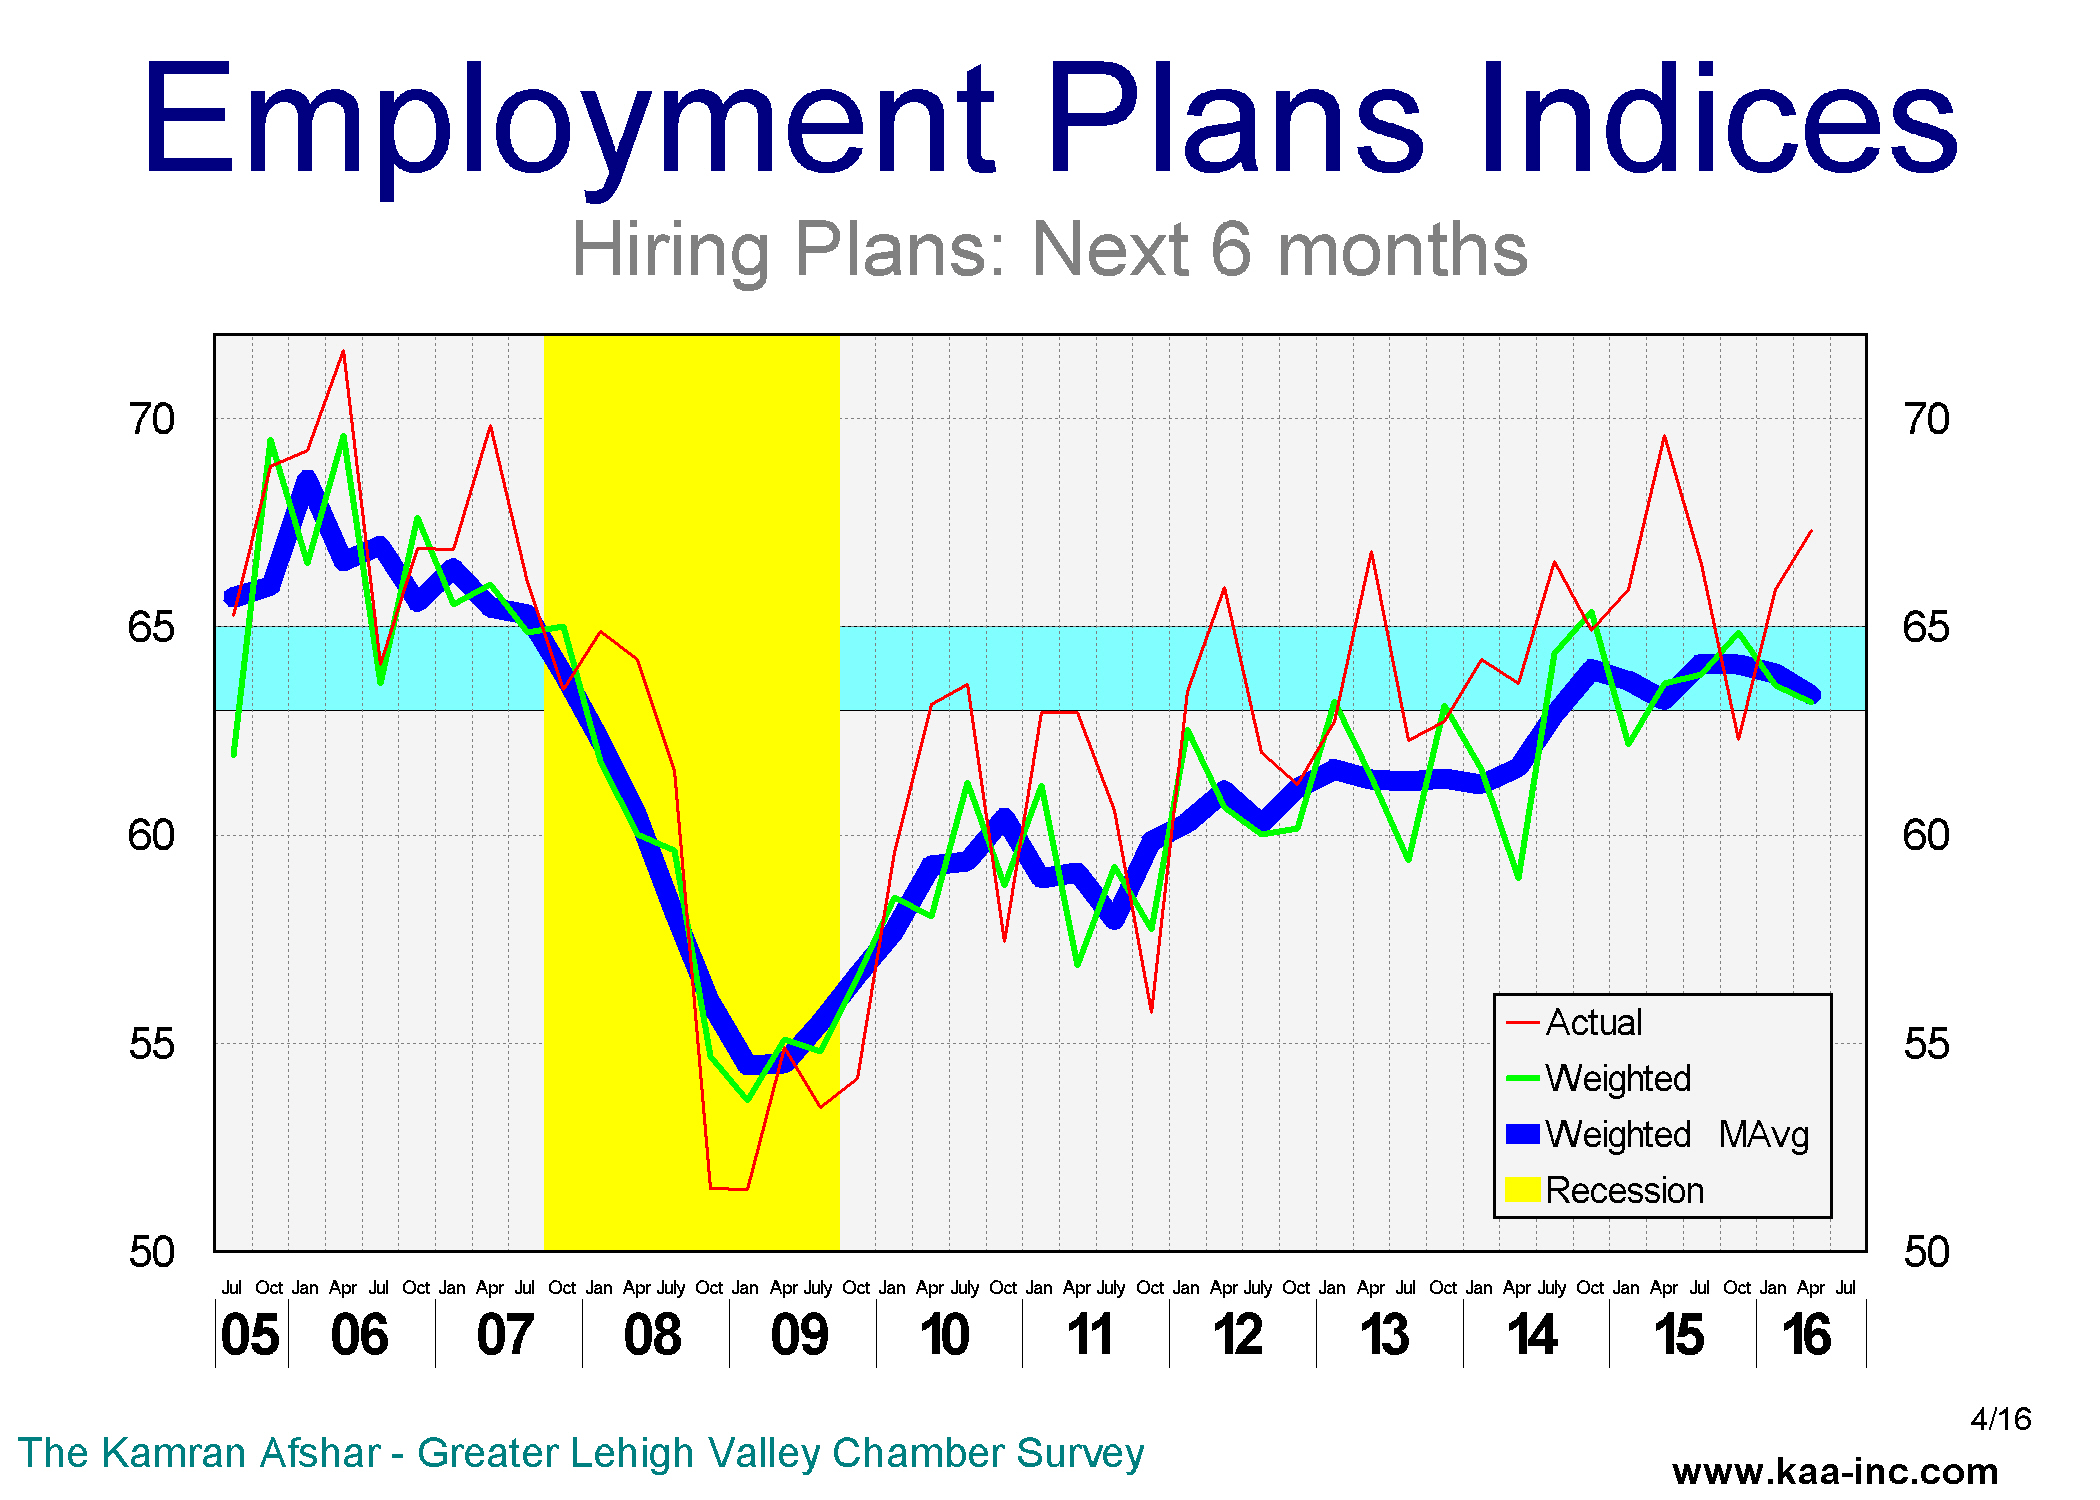
Average participant in the survey is planning to hire one new employee in the next 6 months, similar to the previous surveys.
Around 36% of the participants are also planning to hire more people, an up-tick for this indicator, while only 6% of them plan to lay off employees in the next 6 months, similar to previous surveys. The layoff plans are now in the same range that they were before the recession.
The overall index of business sentiment has dropped by 7% since last October, and this is a cause for concern, however, the index is still higher than its 2014 level. And at this level we still expect to see economic growth, may be little slower than previous years. Among different size businesses, the ones with 11 to 20 employees appear to be growing at a faster rate than the rest in the Lehigh Valley.
LV Business Sentiment January 2016
Businesses with 6 to 50 employees reported the largest increase in their planned hiring for the next 6 months
The Kamran Afshar- Greater Lehigh Valley Chamber of Commerce survey of Lehigh Valley businesses is done on a quarterly basis and collects about 800 observations per year. The Employment and Purchasing Index for the Lehigh Valley highlights the results of these surveys.
In January 2016 we conducted our 65th quarterly survey of this series. According to the survey, and despite the slight drop in January, the overall business sentiment is trending steadily upwards in the Lehigh Valley.

Business sentiment, as measured by the overall index eased down slightly to 63.4 in January, recording its second highest level since before the recession, the highest level was 64.5 back in October of last year. It should be noted that the highest level for the index (68.5) was reached in April 2006, and its lowest point was when the index fell to 44.4, in April 2009. And despite the slight drop in January, the Valley’s overall business sentiment trend is continuing to move up steadily, albeit slowly. The index and its long term trend are moving very close to the range that is historically associated with rapid growth.
 The only indicator in our model which recorded an increase in January was actual purchases in the last 6 months. This indicator, at 66.8 it stands 4.4% above its October 2015 level and 9.2% above its last January 2015 level. And it is at its highest level since before the recession. Local businesses have increased their expenditures more in the last 6 months than any time since 2007.
Over the last 6 months, 43% of the local businesses participating in our survey increased their expenditures while only 8% reduced theirs. The average business participating in our survey increased its expenditures, by 2.1% in the last 6 months.
The index for purchasing plans for the next 6 months at 64.9 is in a statistical tie with its October 2015 level. The index’s trend, however, is at its highest level since before the recession and is almost at the bottom of the “expansion” range for the first time since 2007.
While the percentage of companies which are planning to increase their expenditures has not measurably changed since October 2015, the amount of their planned expansion has dropped.
 The hiring plans index for the next 6 months, has been almost flat since April 2015, while being slightly higher than last January’s level. This index has been running close to the range which is historically associated with rapid growth since April 2015. And all of this happened despite a significant decline in actual hiring in the last 6 months. Businesses with 6 to 50 employees reported the largest increase in their planned hiring for the next 6 months. The average business participating in the survey is planning to hire 1.1 more employees in the next 6 months. Going forward, healthcare, professional and technical businesses are planning to hire more people than others during the next 6 months.
A third of all businesses participating in our survey are planning to hire more people, while only 6% of them plan to lay off employees in the next 6 months. Plans for layoffs are now similar to what they were prior to the recession.
 In contrast to increased plans for future hiring, the index for actual hiring over the last 6 months dropped by 7.3%, the largest decline among the January indicators in our model. That somewhat correlates with the drop in total employment in the Valley over the last 6 months.
However, despite the dip in January, the index of actual hiring is trending upwards, and is closing in on its pre-recessionary levels. Businesses with more than 50 employees reduced their new hiring significantly in the last 6 months, while those with less than 21 employees increased theirs slightly. The average business participating in the survey hired 0.6 employees over the last 6 months. Manufacturing, transportation warehousing and information related businesses reduced their employment levels while healthcare and professional / technical businesses increased theirs.
Over the last 6 months, 28% of the local businesses participating in our survey expanded their employment while 14% reduced theirs.
The index for purchasing plans for the next 6 months is in a statistical tie with its October 2015 level. Despite that, its trend has almost reached the range which is historically associated with rapid growth.
Fifty-seven percent of the businesses participating in our January survey reported
increases in their revenues over the last 6 months, while 19% experienced a decline in theirs. Expectation of higher future revenues jumped significantly from only 49% in October 2015 to 61% in January 2016. Also the percent of companies which expect to see lower revenues in the next 6 months dropped in January to 14%, down from 21% recorded the previous October.
Based on the results of our January survey we expect the Valley’s economy to return to its previous slow but steady growth. The slower than expected growth during the 4th quarter of last year which resulted in a decline in local employment appears to be behind us. The expectation is that local employment growth will resume, albeit at a slower pace, by spring. Based on labor pool and the projected growth data, we also expect to see a measurable increase in local wages in this year.
Despite the oil oversupply, the US Energy Information Administration is forecasting a significant price increase in 2016
Forecasting oil prices with any reasonable accuracy appears to be beyond the scientific abilities of most economists including this one.
Basic methodology of any price analysis is to brake the market into its primary components, supply and demand.
Global supply of oil during the first half of 2014 was hovering at around 92 million barrels per day, slightly more than 0.5 million barrels higher than global oil consumption (demand) a small over supply according to the US Energy Information Administration. Despite of that oil prices rose by about 5% in the first half of 2014.
Oil production started a rapid increase during the second half of 2014, rising to more than 95 million barrels per day by the end of the year. Global Demand for oil as measured by consumption, responding to the huge drop in prices also rose, but only to slightly higher than 93 million barrels, resulting in further increase in surplus.
Cushing Oklahoma is a vital transshipment and storage facility in US, its storage reserves was estimated at 20 million barrels in June 2014, by the end of last year its reserves rose to more than 30 million barrels an increase of 50%.
Thus far the basic tenets of economics has worked, as supply increased rapidly, prices dropped and inventory rose.
However, the increase in production was only 2% by the end of 2014 and rise in demand accounted for half of that increase, so a prices decline of 44% drop appears excessive. Here is where we have to make some minor adjustments to the basic pricing model.
In reality price models are by far more complicated, we have to allow for a number of other variables, some straight forward like inventory, which in this case recorded a major increase, and some more complex like expectations of future supply and demand and an array of different variables, including the asymmetric production cost variables. And then of course there are all the “non-economic” variables like political tensions, wars, etc.
Between January and June of 2015 supply of oil remained relatively constant close to 95 million barrels per day, and there was a slight drop in consumption. Resulting in an average surplus of 2 million barrels per day. Cushing oil reserves vaulted up by 81%. Despite of these, price of oil rose by 27%, during the same period.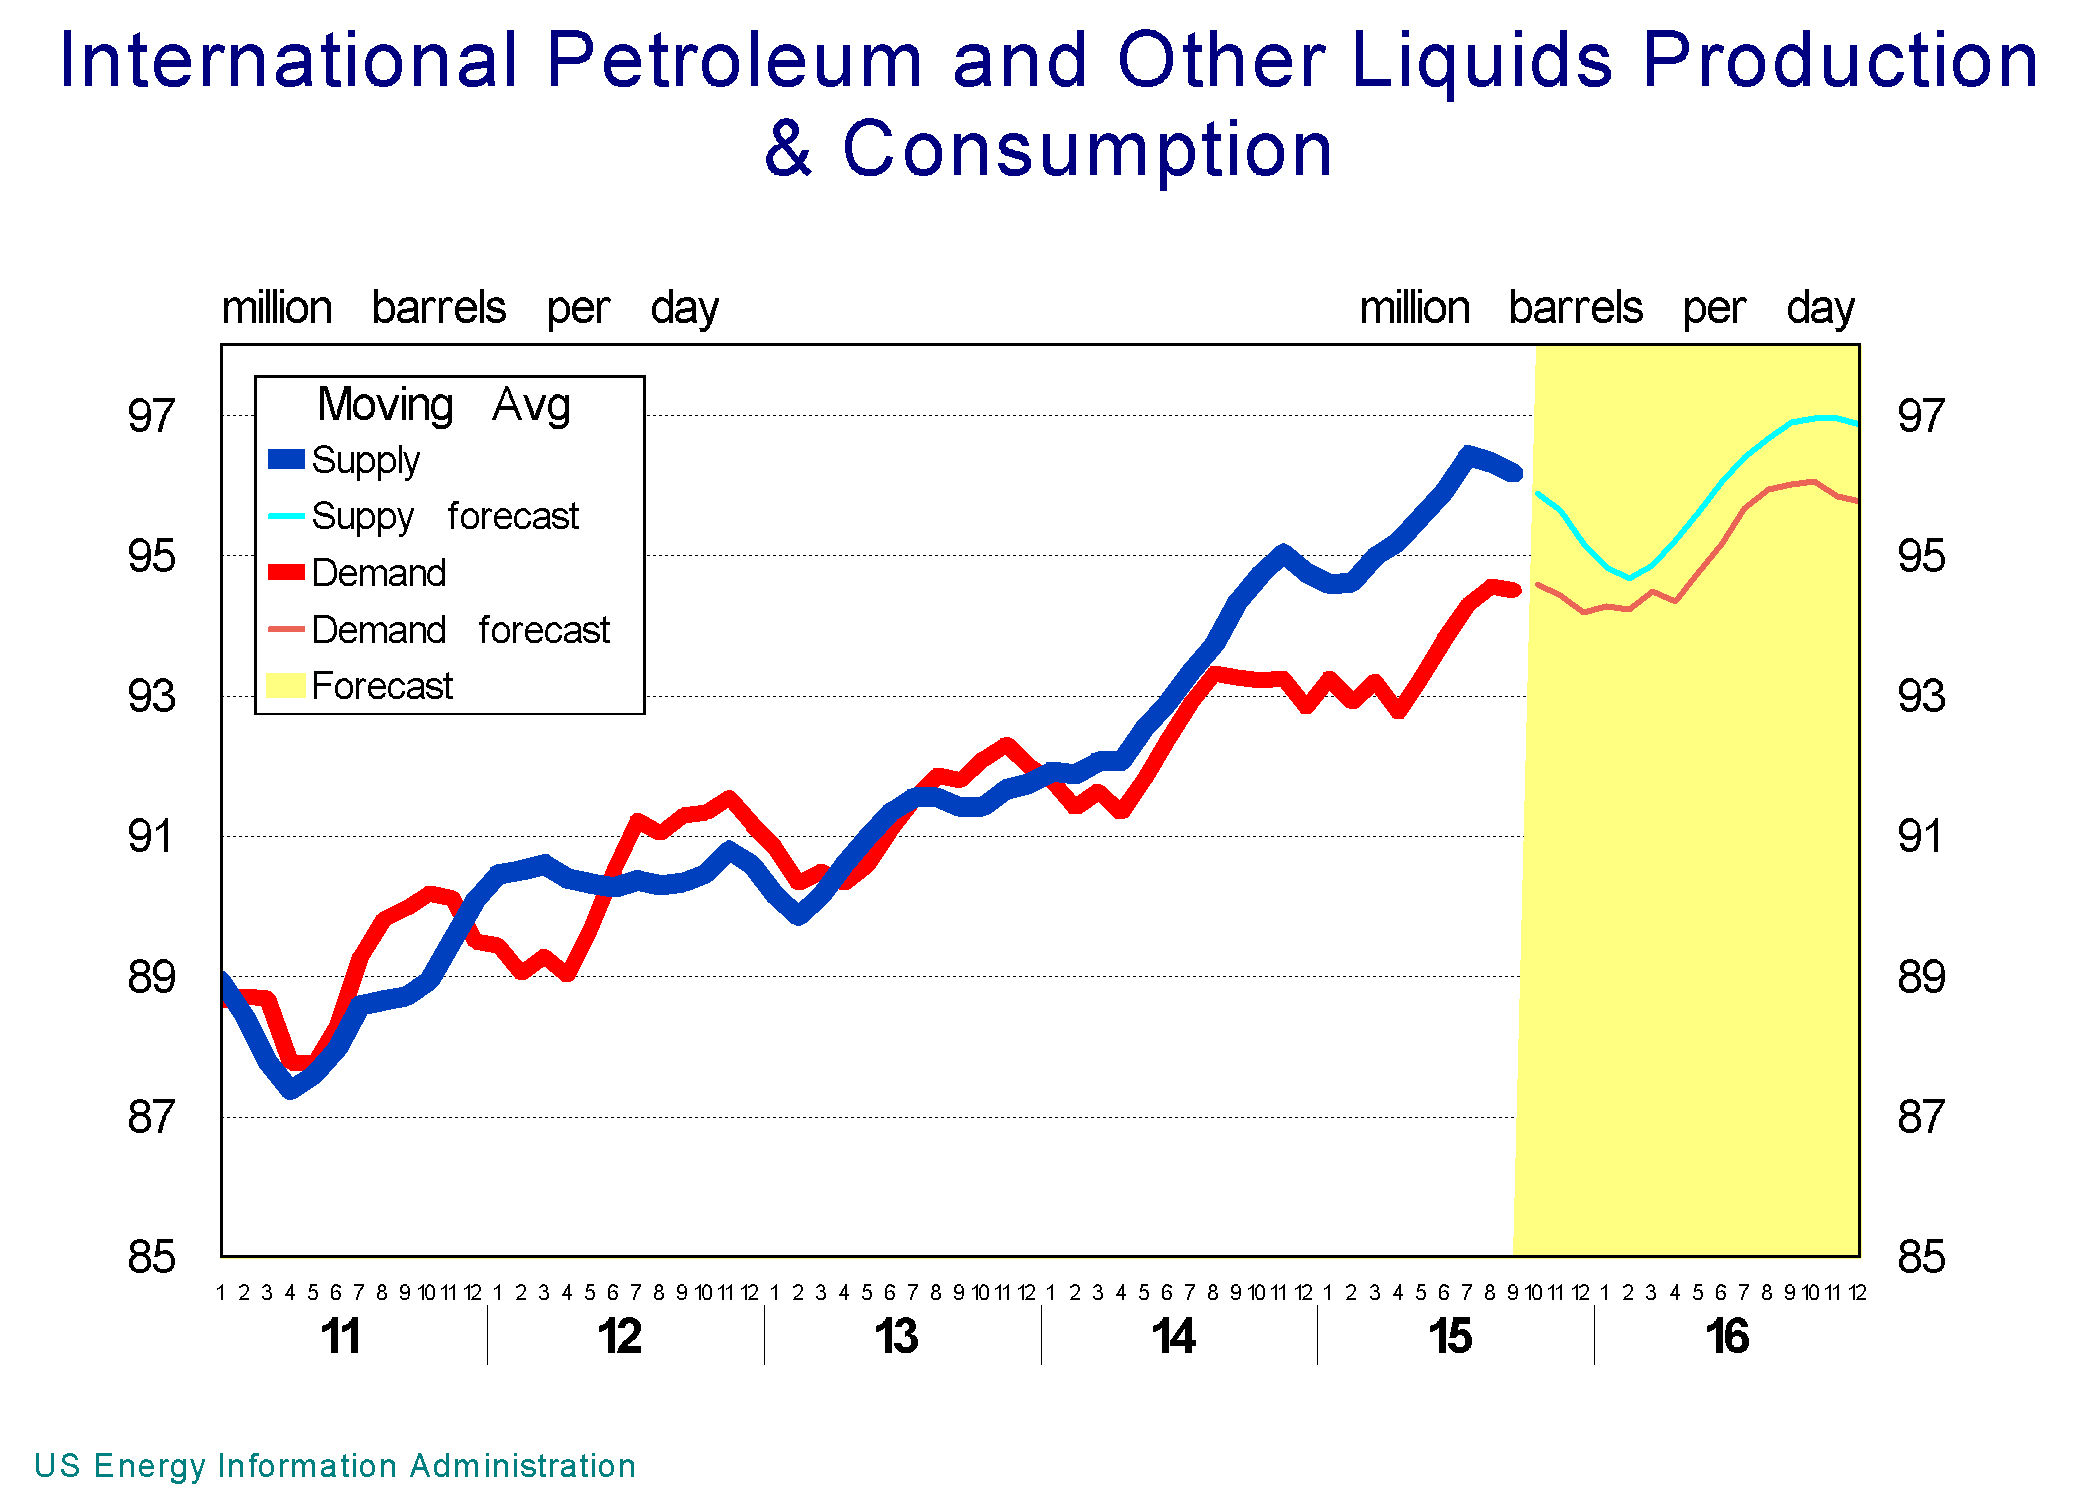
As of the end of October, Cushing reserves were two-and-a-half times what they were at the end of October of 2014. Total oil supplies is estimated at 96 million barrels per day close to around 2 million barrels higher than total global demand for oil. And US Energy Information Administration forecasts a continuation of significant surplus production for the balance of this year and 2016. However, and all at the same time they also forecast a significant 20% increase in price of oil by next June. An interesting puzzle!
Data source: US Energy Information Administration
What percent of new jobs created after the recession are full-time jobs?
One of the major subjects of discussions about the constant changes that we see in our economy is the composition of full verses part time jobs. Are most of the new jobs being created since the Great Recession part-time jobs?
During the Great Recession we lost a disproportionate number of full-time jobs compared to previous recessions. By the end of 2009, a year into the recession, more than 11.3 million or 9.3% of all full-time jobs were lost. During the 2000-01 recession the drop in full-time jobs was 2.2 million accounting for only 2.0% of all full-time jobs. Even in the devastating double dip recession of 1980-84, the full-time job loss was 3.3 million which back then accounted for 3.9% of all the full-time jobs.
There are two types of people who hold part-time jobs, there are those who actually want a part-time job and are not looking for anything else, and then there are those who are holding part-time jobs solely due to economic reasons, that is they are looking for a full-time job but out of economic necessity have accepted a part-time job for now. These are what the Bureau of Labor Statistics labels the later group as “involuntary” part-timers. Over the last 50 years, the highest level of involuntary part-time jobs was at 37.3% which happened in 1982 during the double dip recession of the time, and lowest percentage was 13.6% which happened at the end of 1999. During the economic boom years of 2003-06 this number averaged at 18.0%. There are always people who hold part-time jobs who are looking for full time position. The distinction of this group is that while they are holding a part time job they are still looking for full time job, and as such are in actual competition with those we actually count as unemployed for a job.
During the Great Recession, the percent of involuntarily part-timers as a share of all part-timers rose to 33.8% by 2009. One out of every three part-time workers was looking for a full-time job while out of economic necessity had accepted part-time work.
The number of people who involuntarily held part-time jobs rose by 4.5 million during the 2008-09 period.

Labor market started to improve from the beginning of 2010. The number of full-time jobs started to rise along side some gains in the number of regular (voluntary) part-time jobs. Also of importance is that the number of involuntary part-time jobs started to drop. As of September 2015, the percent of involuntary part-timer dropped to 22.4%. Not yet back at around 18% which prevailed during the early 2000s, but far for the more than 33% which prevailed in March 2009.
The total number of jobs created since December 2009 is 10.8 million. Since we lost 8.6 million jobs during the Great Recession, the economy is now 2.2 million jobs ahead of where it was in 2007. This however, does not tell the whole story, in the sense that it combines part and full-time jobs. To get a more accurate look at this, we need to dissect the data to its proper components.
The total number of full-time jobs created since December 2009 is 11.3 million. Considering that during the Great Recession we lost 11.3 million full-time jobs, we are just back where in November 2007.
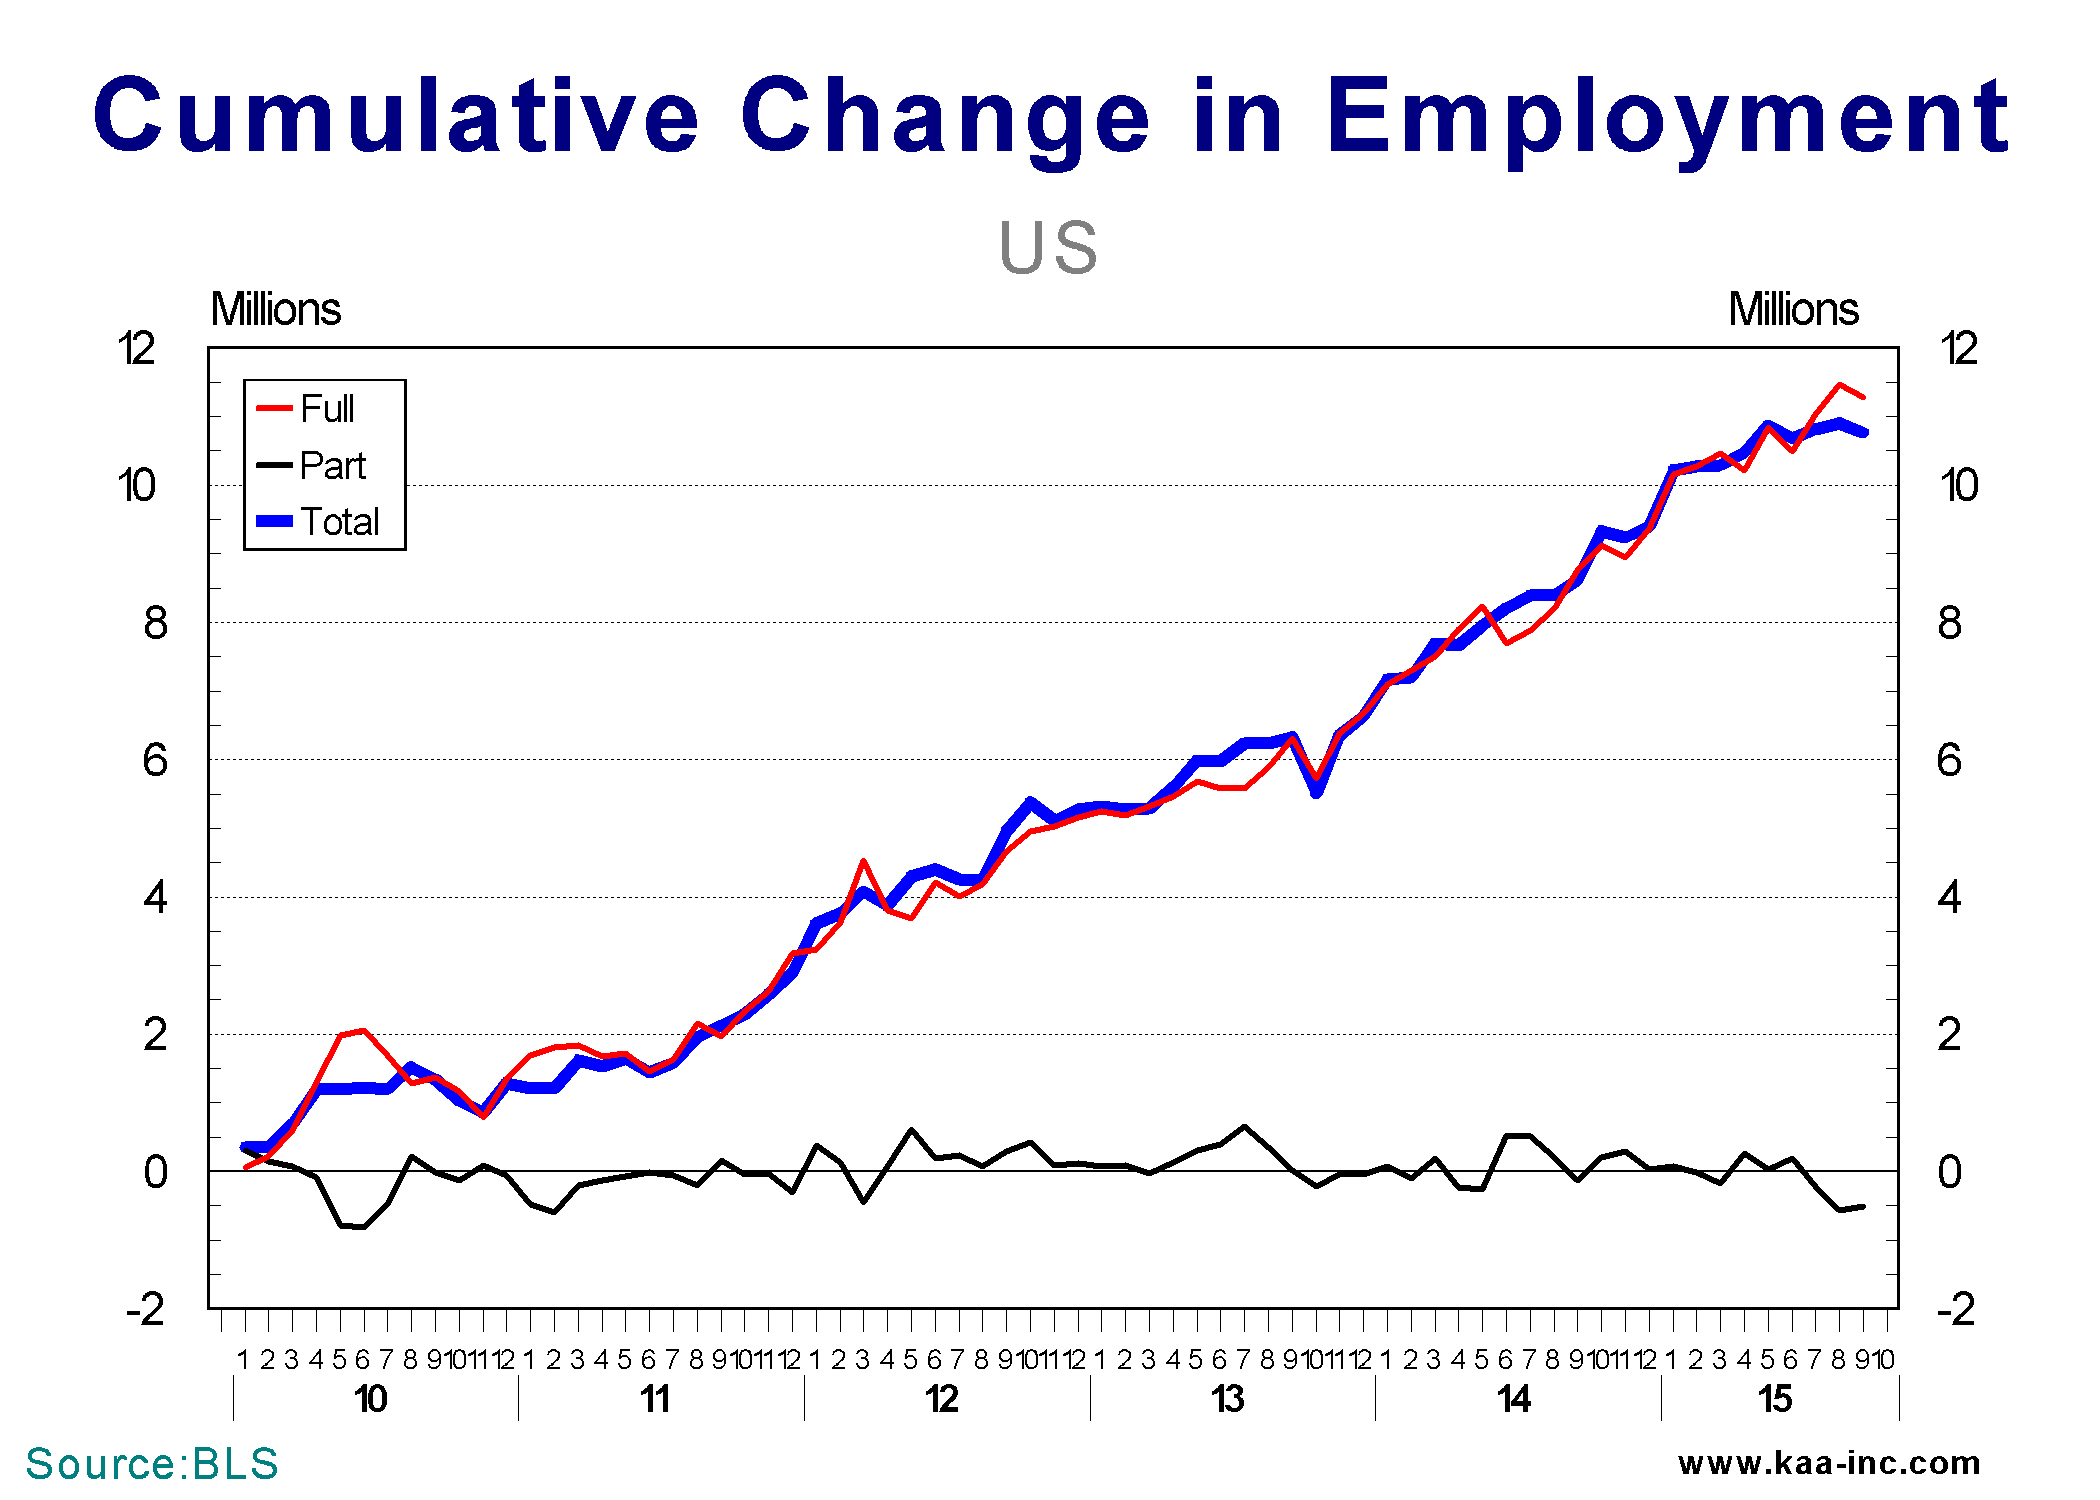
Part-time jobs reacted differently to the recession, while the number involuntary part-time worker zoomed up to 4.5 million, the number of those who regularly held part-time jobs collapsed by more than 2 million during the recession. Between December 2009 and September 2015, the total number of part-time jobs has dropped by 0.5 million. This doesn’t mean that no new part-time jobs were created since 2009, actually 2.5 million new regular part-time jobs were created, however, almost 3 million part-time jobs held involuntarily have gone away resulting in a net loss of 0.5 million in total part-time jobs.
Between December 2009 and September 2015, the economy created 11.3 million full time and close to 3 million regular part time jobs. This puts the number of jobs added at 14.3 million. Accordingly, 79% of all the new jobs created after the recession are full-time jobs. During the same period 3.5 million involuntary part-time jobs were lost or converted to full time. Subtracting the jobs lost form those added gives us a net gain of 10.8 million jobs since December 2009.
The job market continues to expand at a healthy rate, and the ratio of full time to part time jobs is holding relatively constant. Over the last 12 months, 8 out of every 10 jobs created were full time Jobs. Accordingly the notion that most of the jobs that are being created are part-time jobs, is grossly inaccurate.
Local businesses have spent more in the last 6 months and are planning to spend even more in the next 6 months, than at any time since 2007.
The Kamran Afshar- Greater Lehigh Valley Chamber of Commerce survey of Lehigh Valley businesses is done on a quarterly basis and collects about a thousand observations per year. The Employment and Purchasing Index for the Lehigh Valley highlights the results of these surveys.
In July 2015 we conducted our 63rd survey of this series which recorded continued optimism in the local economy.
Business sentiment, as measured by the overall index dropped slightly to 61.1 in July, and is just slightly above its July 2014 level. It should be noted that the highest level for the index (68.5) was reached in April 2006. Subsequently the index fell to 44.4, its lowest point, in April 2009. The overall index’s trend has been sideways since Last July and despite that it is higher than any time since 2007.
The index of past purchases and plans for future purchases has been running in the range which is historically associated with expansion. Which means local businesses have spent more in the last 6 months and are planning to spend even more in the next 6 months, than any time since 2007.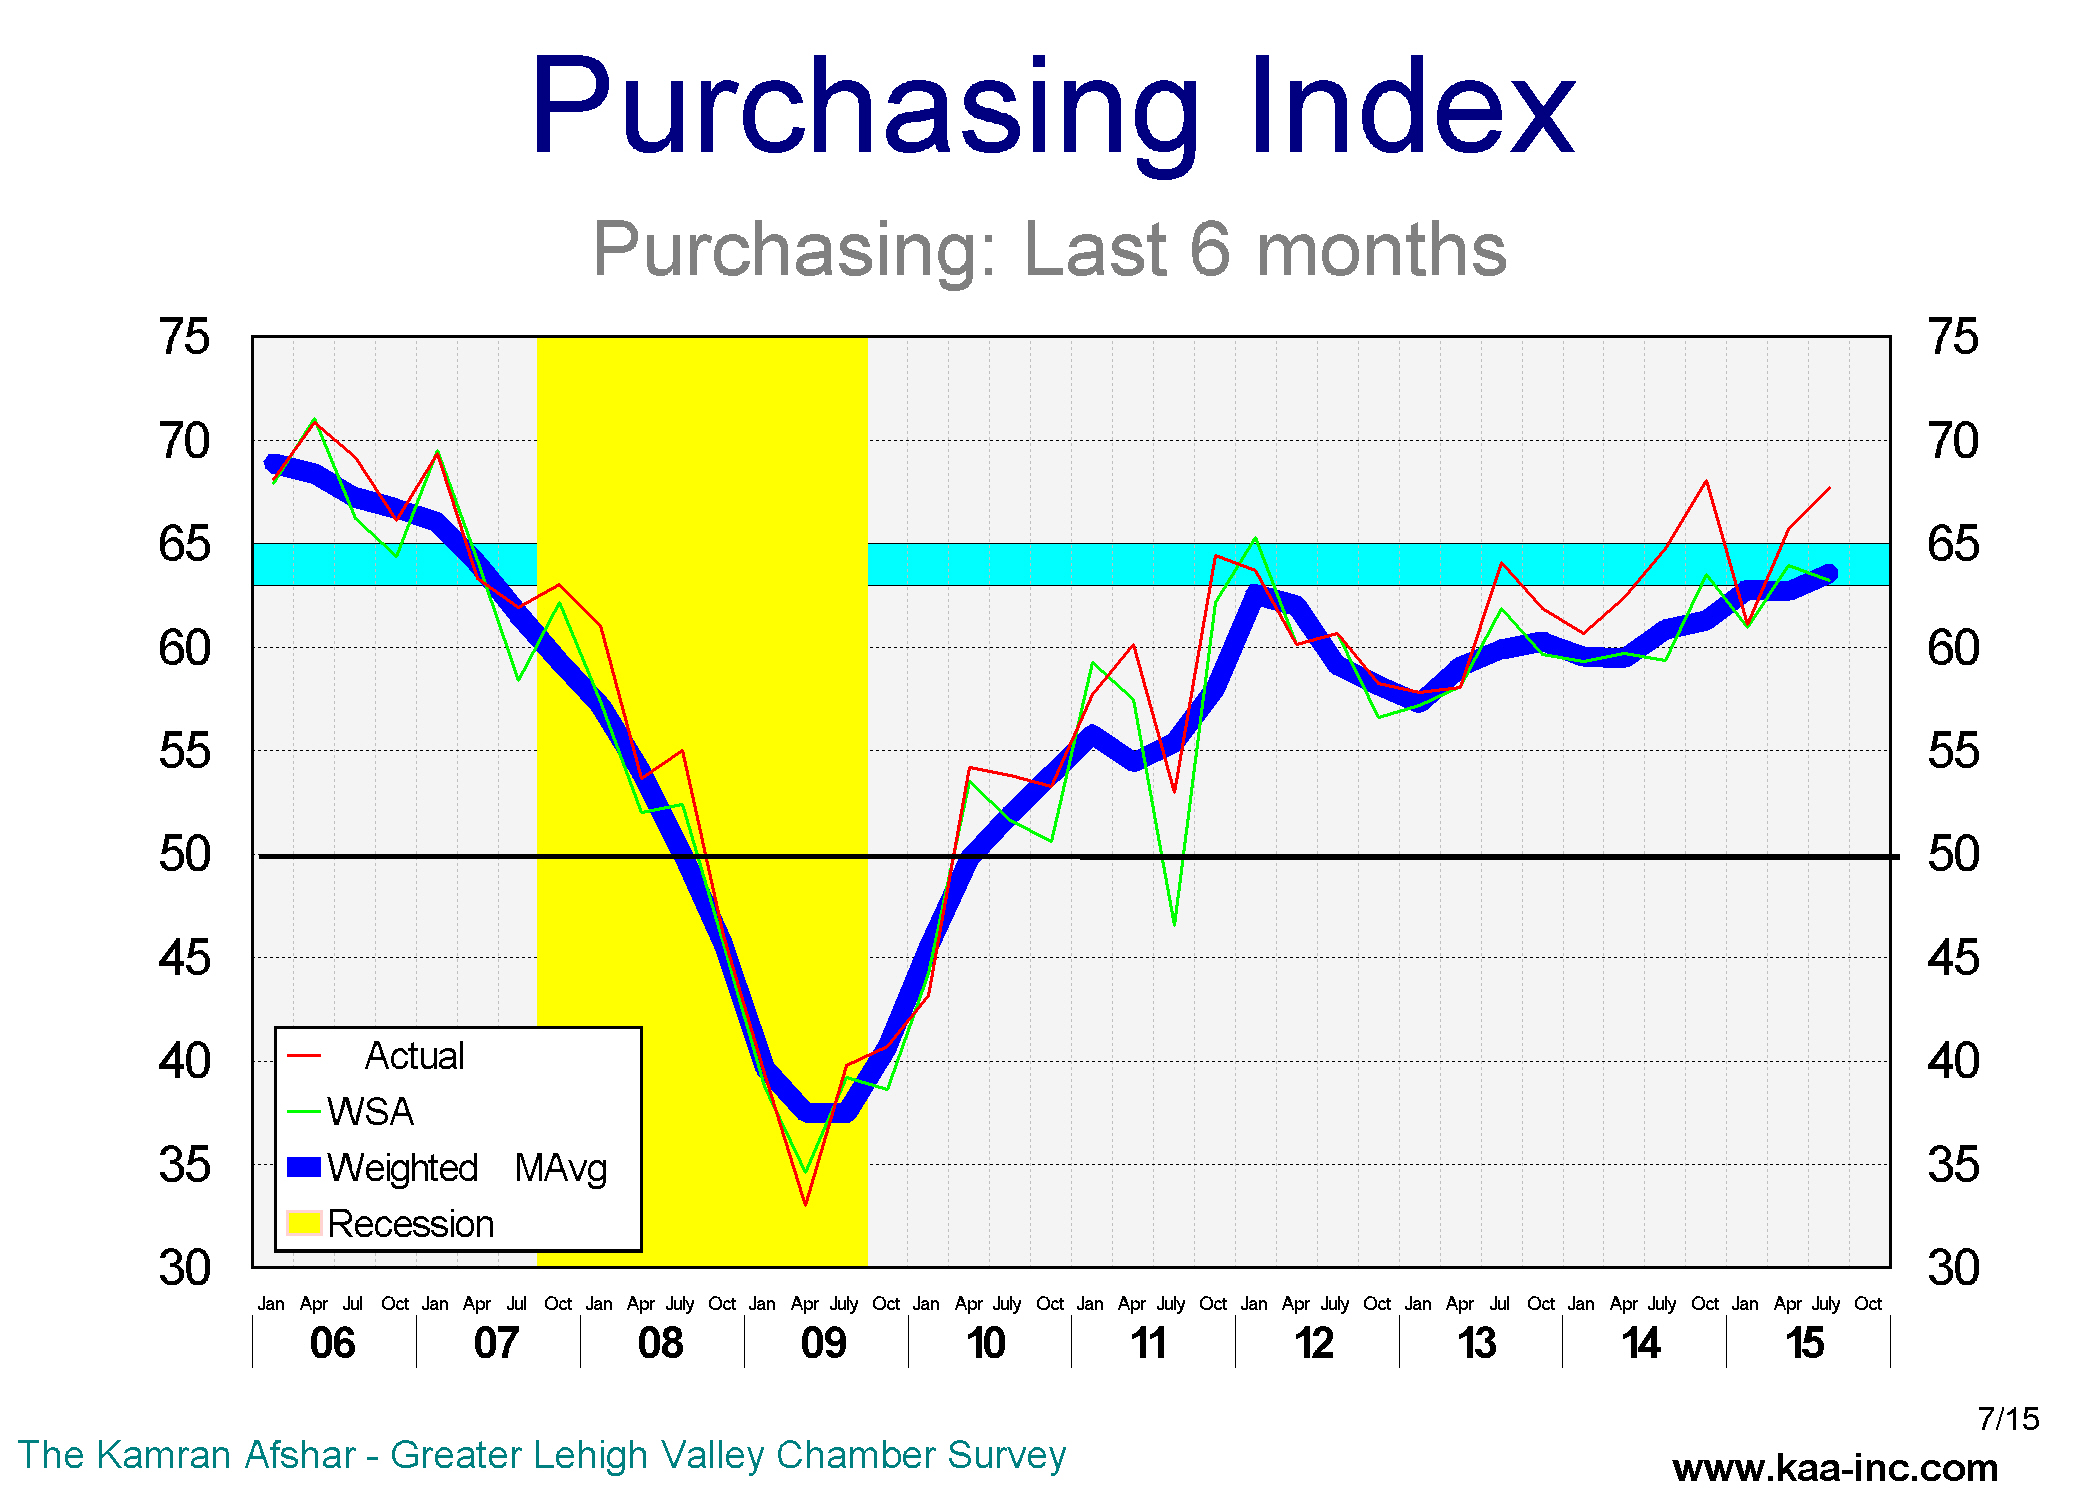
The largest gain in the last 12 months continues to be in the index of purchases during the last next 6 months. This index is 6.4% above its July 2014 level and also in the expansionary range. And it now trends higher than anytime since the recession.
Local business’ planned expenditures did not change significantly from its April level, and is slightly higher than its July 2014 level. This index has been in the expansionary range since last October, a very positive sign for the local economy. While 40.4% of the local businesses are planning to increase their expenditures over the next 6 months, only 7.7% are planning to reduce theirs.
Local businesses have spent more in the last 6 months and are planning to spend even more in the next 6 months, than any time since 2007.
One of the indices which recorded a measurable decline is the index of hiring over the last 6 month. This indicator dropped to 54.3 in July, a drop of 4.8% since April 2015. This index has been oscillating up and down within a 5% range since January of 2014.
Twenty-one percent of the respondents to the survey indicated that they had net additions to their employment over the last 6 months, while only 11% reported net losses. During more prosperous economic times around 25 to 30% of the participants showed a net gain while 8 to 10% showed a loss. While we are getting close to the pre-recessionary levels for hiring, we are not there yet.
The average business participating in the survey increased its payroll by 0.7 new employees in the last 6 months. This compares to hiring around one employee in the pre-recessionary years. It should be noted that during the Great Recession, the average local business was reducing its payroll by 0.8 employees. So this is not only a significant improvement compared to the depth of the recession, it is closing in on the pre-recessionary hiring levels.
A third of local businesses are planning to expand their payroll employment in the next 6 months, while 4.9% of the participants are planning to reduce theirs. The average participant in the survey is planning to hire one new employees in the next 6 months. This indicator’s trend is now at its highest level since the recession.
Fifty-two percent of the businesses participating in our July survey reported
increases in their revenues over the last 6 months, while 16% reported a decline in theirs. Looking to the future, a larger 61% expect their revenues to be higher while only 10% expect to see lower revenues.
Based on the results of our July survey we expect the Valley’s economy to continue to show growth over the next 6 months. We expect local companies to increase their expenditures over the next 6 months and while their hiring enthusiasm shows a slight decline compared to April it is still close to pretty strong. For more than a year, companies with 21 to 50 employees lead employment growth in the Valley, we are now seeing that picture revert to a more normal distribution, where the growth is led by larger companies. Overall employment is expected to continue to show growth over the next 6 months.