


Category Archives: KAA Blog
Lehigh Valley business sentiment index zoomed up by 13.1% in April
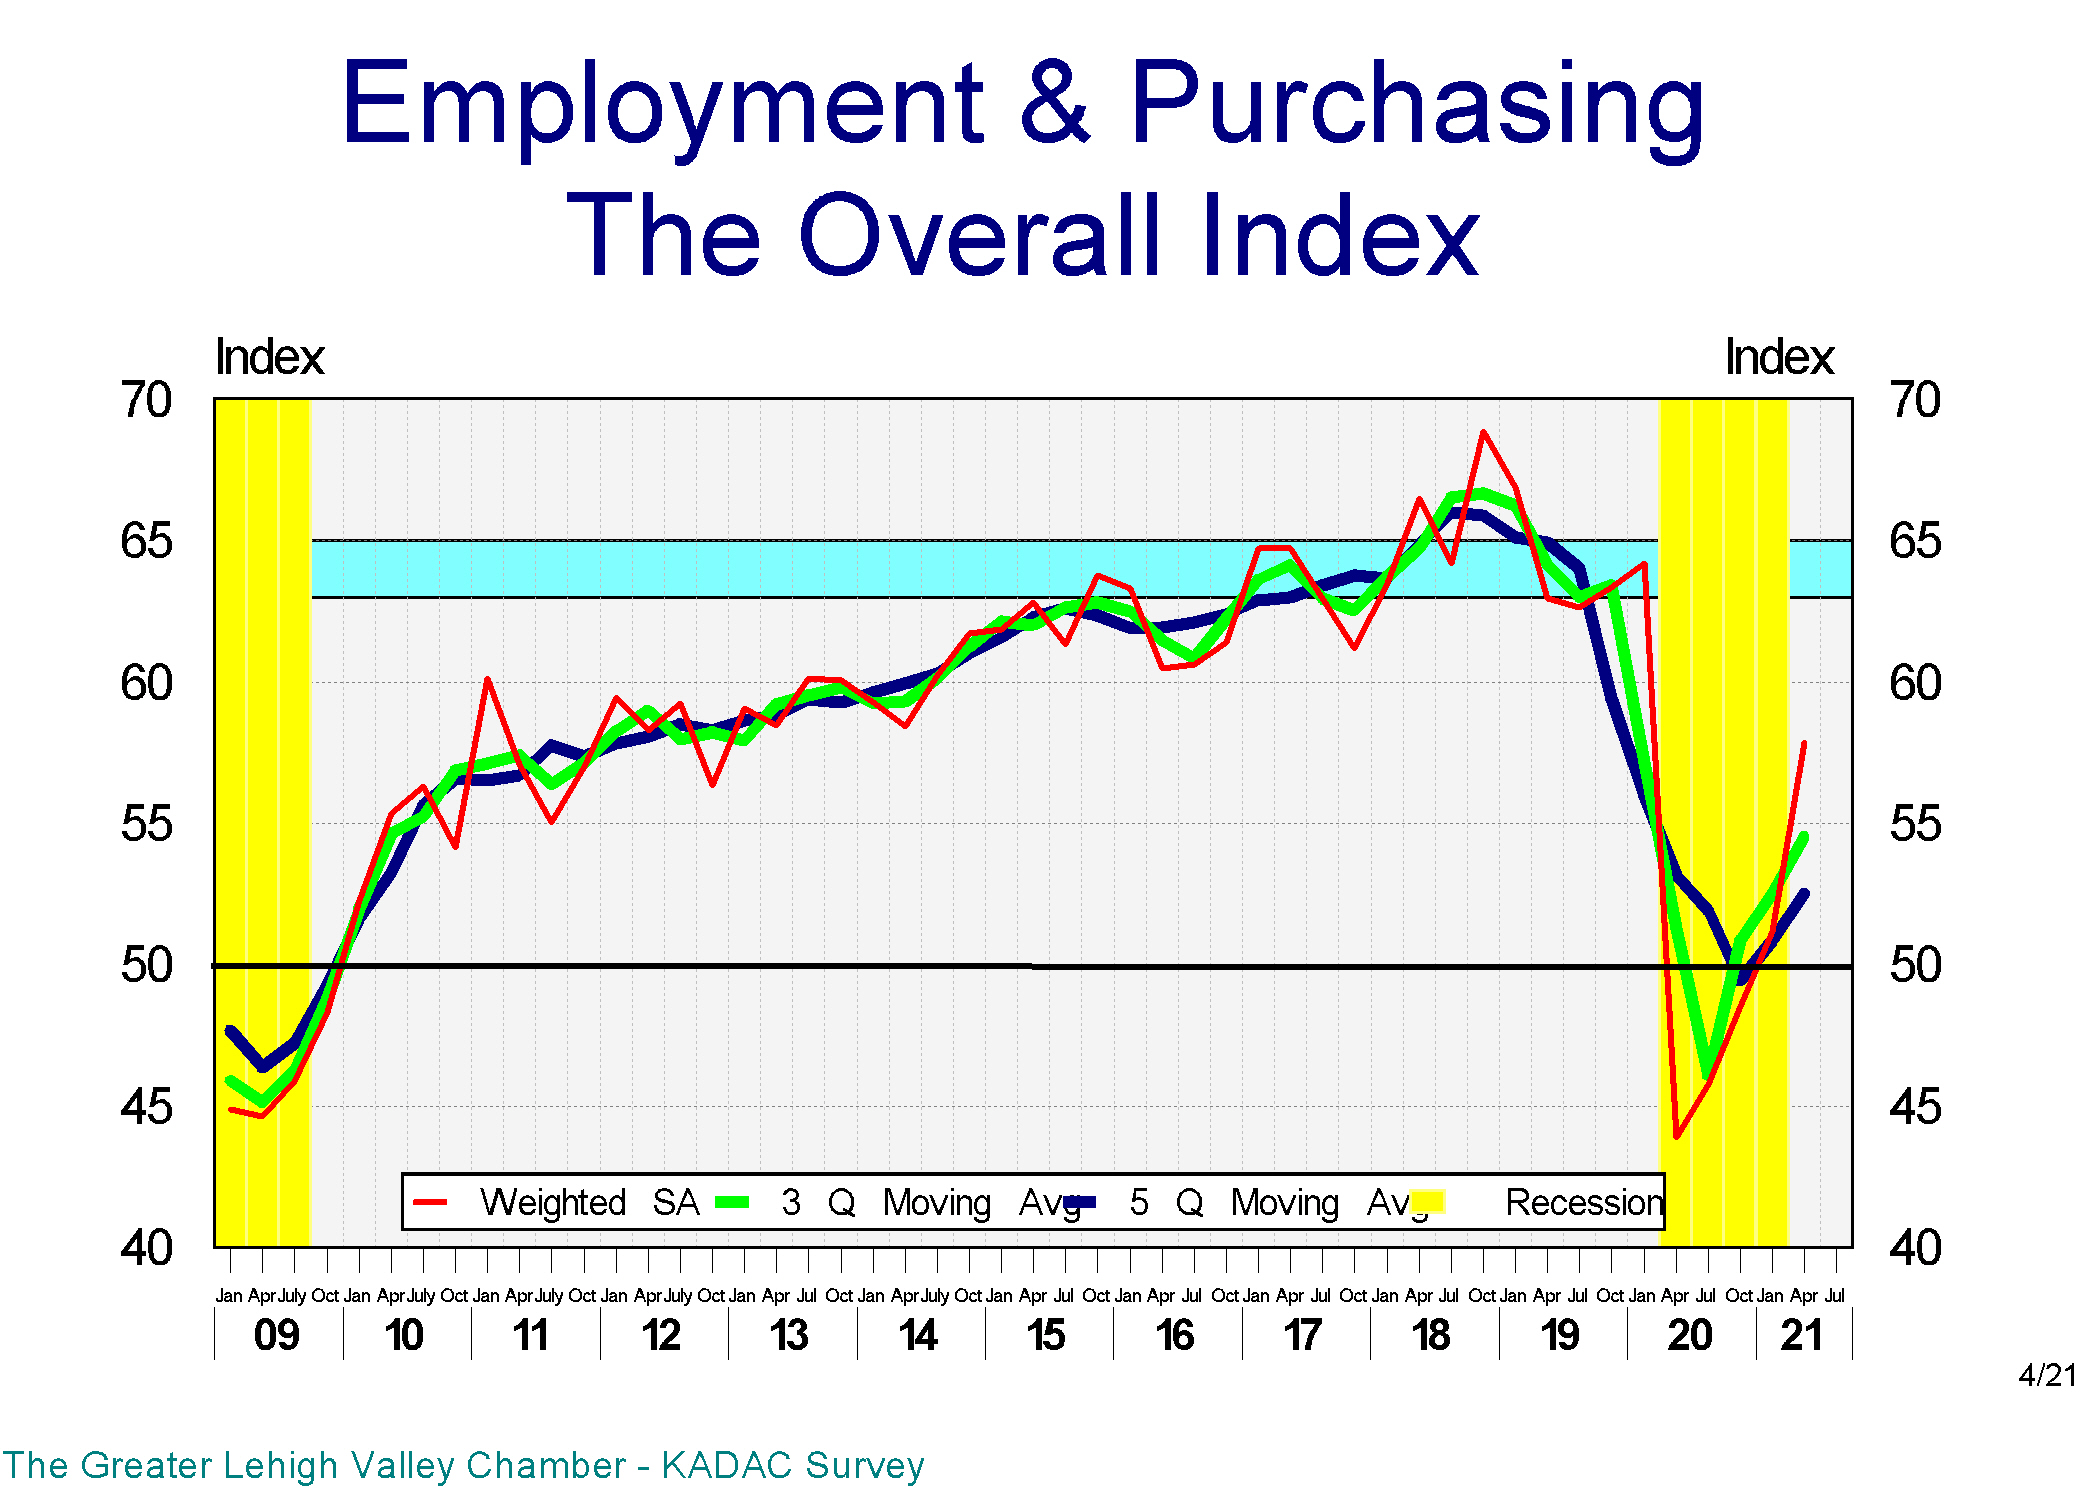
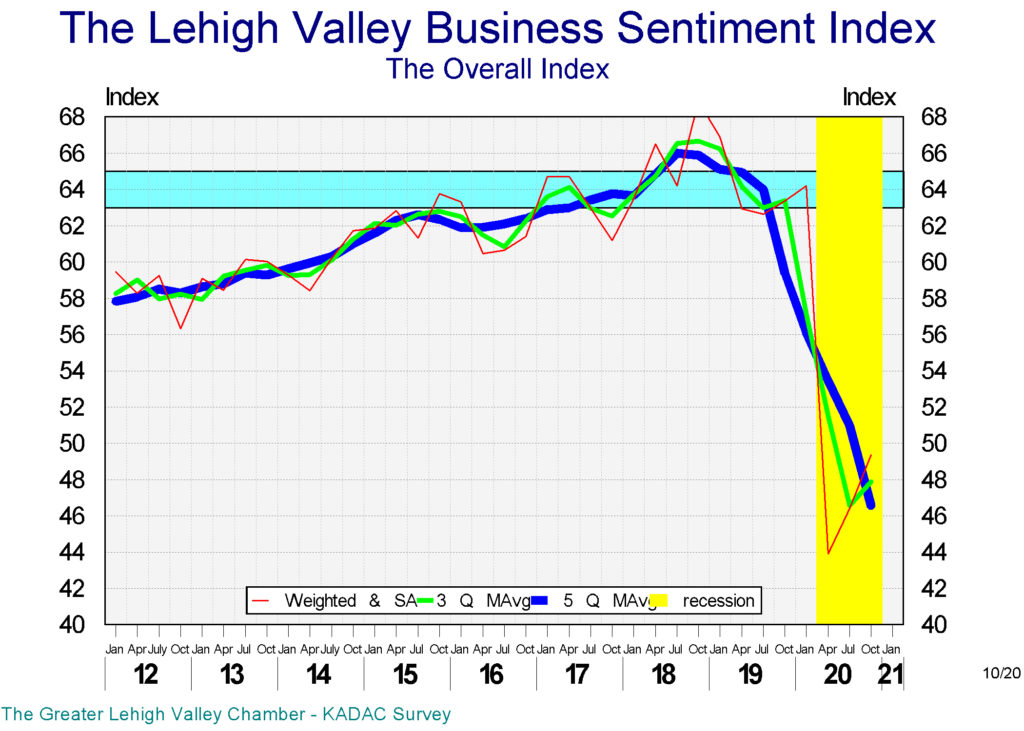
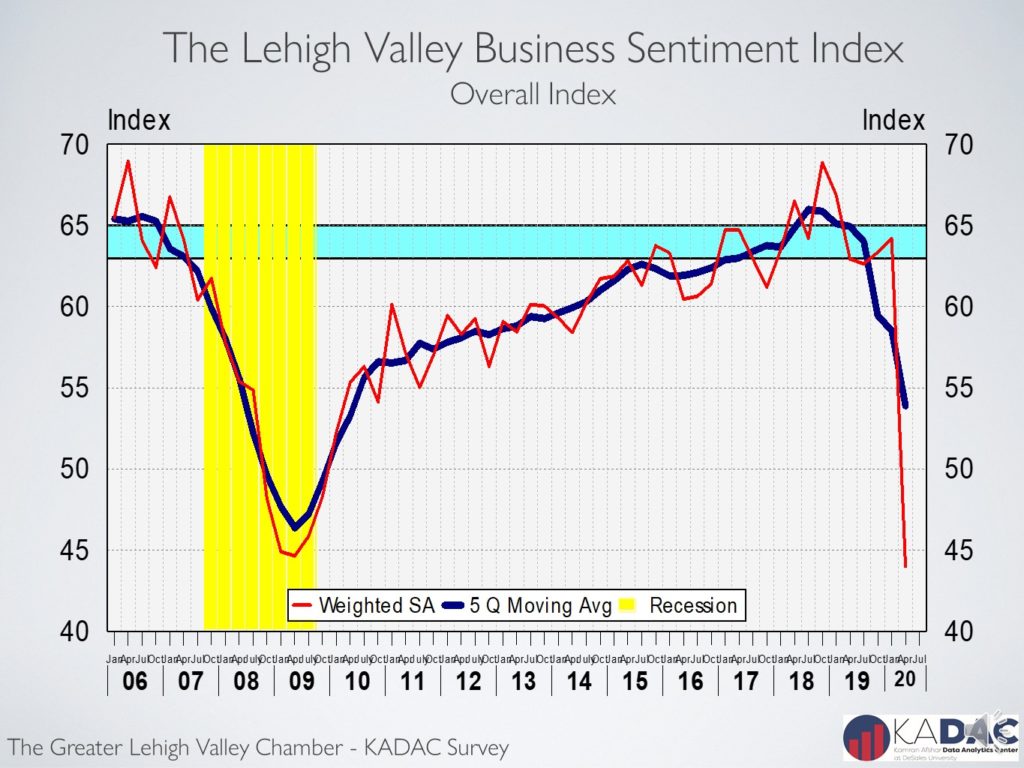
The Lehigh Valley Business Sentiment Index, the BSI, recorded a 13.1% jump in one quarter in April 2021, its highest growth in 10 years. In response to the COVID-19 restrictions, the index plunged to an all-time low of 43.9, a drop of 30.4% in April 2020. Initially, the recovery was slow; by the last quarter of 2020, the index rose to only 48.5, still 25% below its pre-pandemic level. This year, the picture is different; with the rapidly rising vaccination rates, most businesses have started to, at least, think about going back to normal or something resembling that.
The BSI rose 5.5% in January and another 13.1% in April, reaching 57.9, which is 29.1% above its April 2020. This is good news; however, for comparison basis we have to use pre-pandemic references, thus for the April data we are going to use as reference April 2019. And compared to April 2019, the index is still a good 10% short.
The LV BSI is based on the Greater Lehigh Valley Chamber of Commerce-Kamran Afshar survey of Valley businesses done on a quarterly bases since 1998.
Details:
Lehigh Valley business sentiment index rose by only 3.1% in January
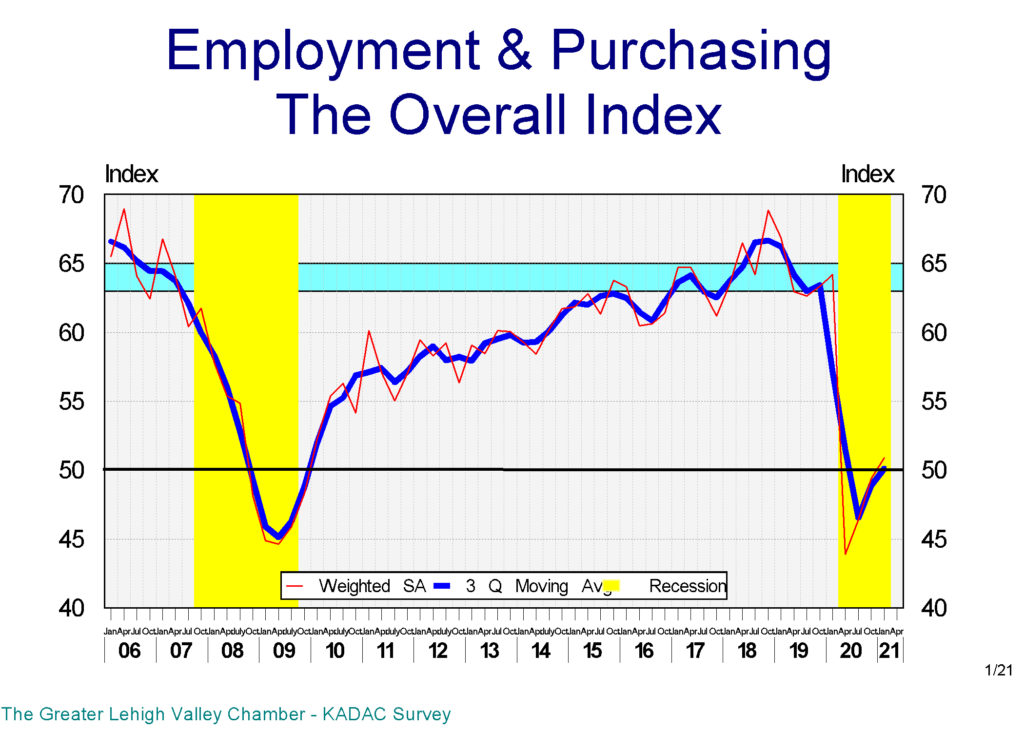
The Lehigh Valley’s business sentiment index, the BSI, made a smaller than expected recovery in January, rising by only 3.1%, a drop from last October’s 5.7% and last July’s 6.4% increases, after its historical 31.6% fall in April. Even after these three rises, BSI for January 2021 has only reached 50.9, well below its January 2020 level of 64.2. However, it has now exceeded its average level during the Great Recession. The diminishing rate of growth of the index is a cause for concern as it indicates a lack of enthusiasm among Valley businesses.
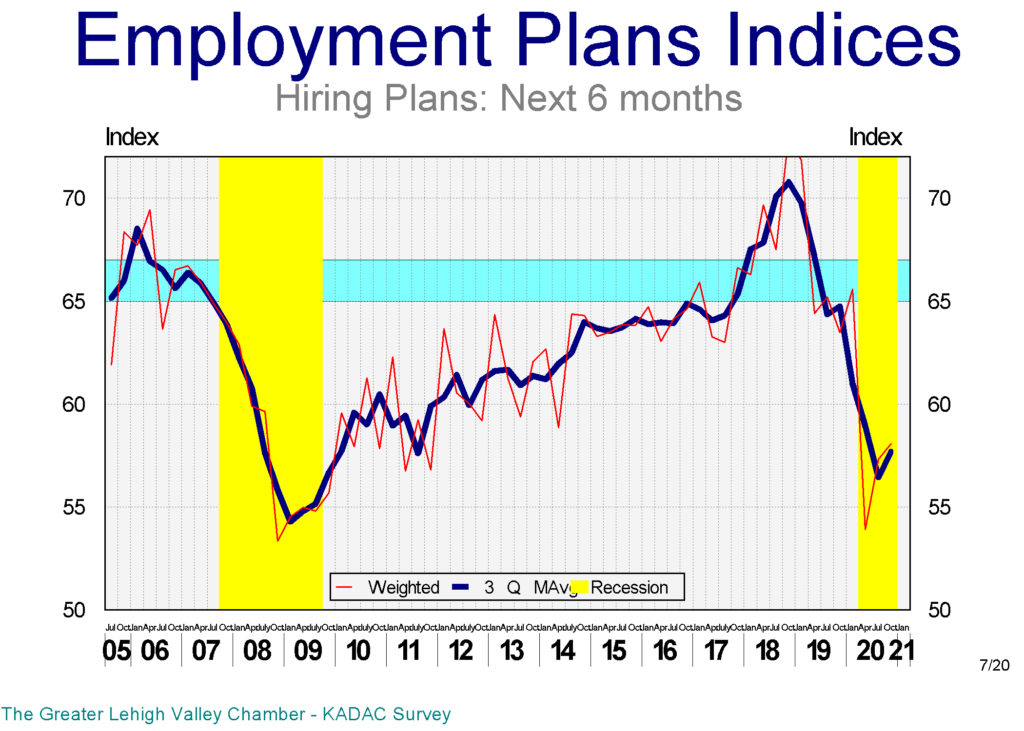
In our model, the largest gain was in the index of plans for future hirings, which rose by 7.3% above its last October’s level, while still 5% below its January 2020 level. It should be noted that this index peaked in October 2018 and was already down by 10.3% in January 2020. The drop in the index was a dramatic 17.8%, according to our April 2020 survey. And while it is now only 5% below its January 2020 level, it is a significant 14.7% below its October 2018 peak in the Valley.

One of the indicators that we calculate for our indices is their momentum. This indicator is the composition of the mass, strength, and direction of the index’s movement. And this indicator, which was at around 100 back in 2019 for future hiring, has dropped close to 60 as of January 2021. All of these indicate that despite its rise in January, the index of future hirings has a higher tendency to drop than to rise over the next 6 months.
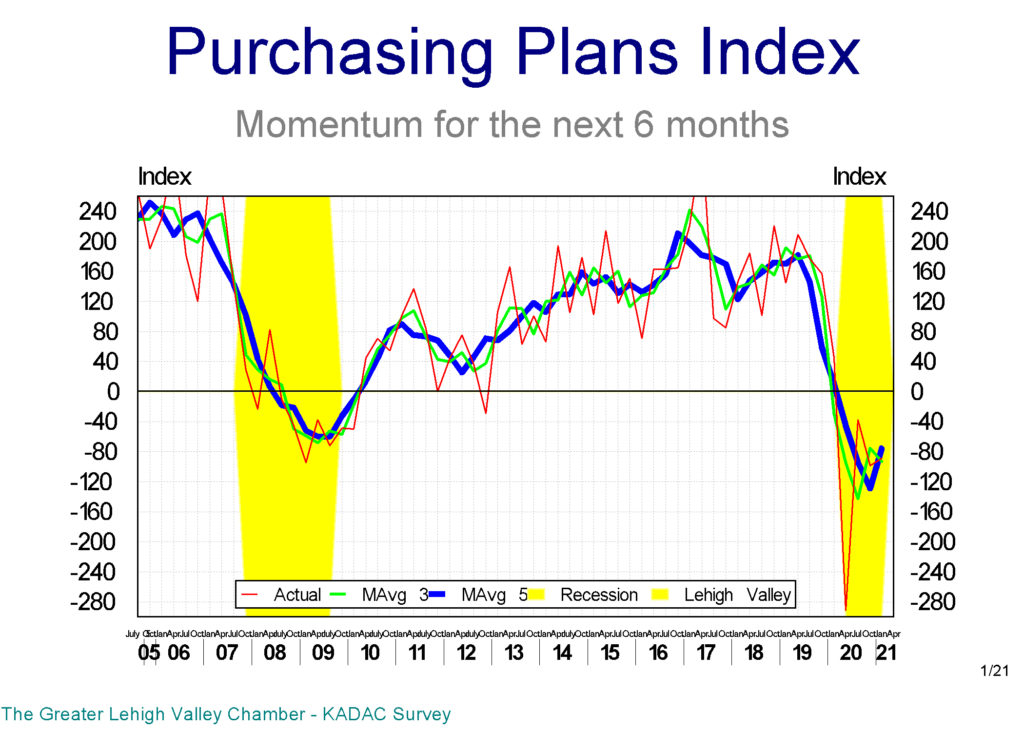
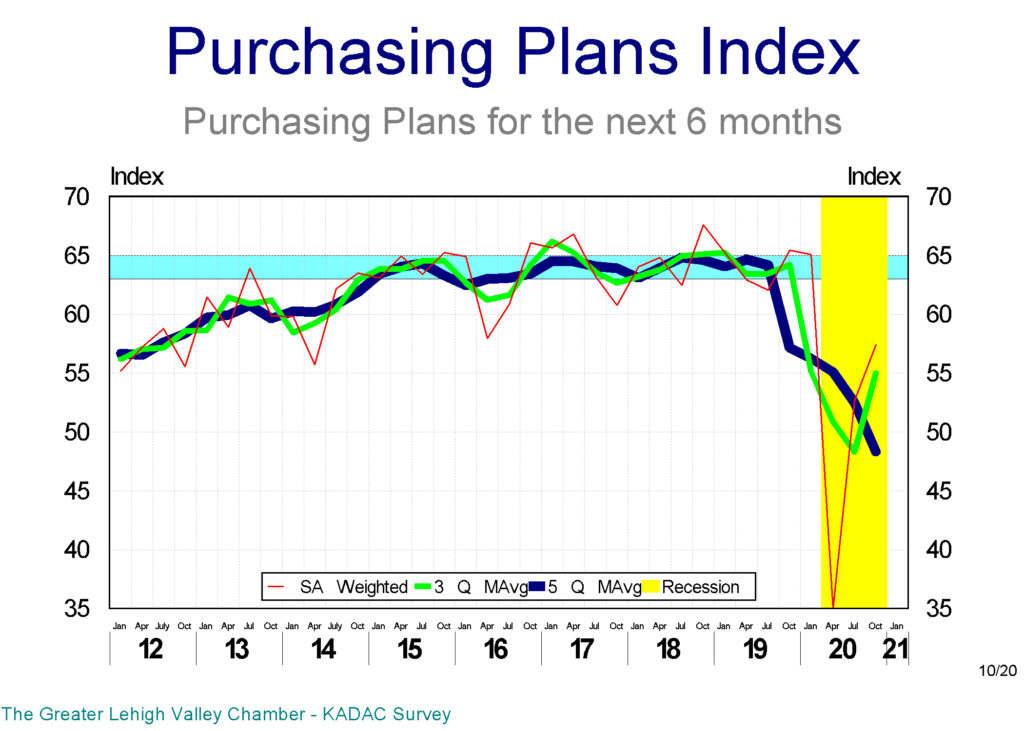
The only index in our model which did not rise in January was the index of future purchases index, which dropped slightly in January, pushing it down to 14.3% below its previous January level.
This index’s momentum is now in around negative 80, a massive drop from positive 160 back in 2019. The index of future purchases is also more likely to drop in the next 6 months than to rise.
The hiring index over the last 6 months, which recorded a slight increase in January, is still 20% below its January 2020 level. This index’s momentum also dropped from an average of positive 50 in 2019 to an average of negative 40 by January 2021.
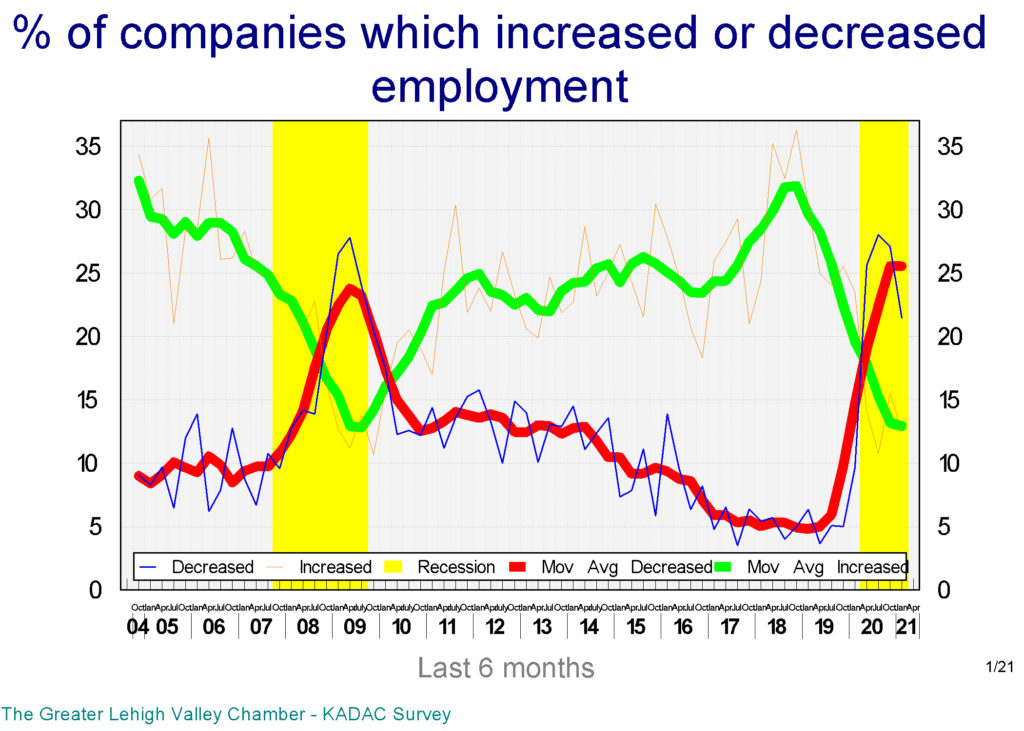
The percent of local companies that reported net layoffs was around 5% during 2018 & 19, while the percentage of those with net hiring hovered close to 30%. These ratios have changed dramatically; in January 2021, 21.5% of the participants in our survey had net layoffs, while only 12.5% of them reported net hiring. To put it simply, layoffs have increased by fourfold, while hiring dropped in half.
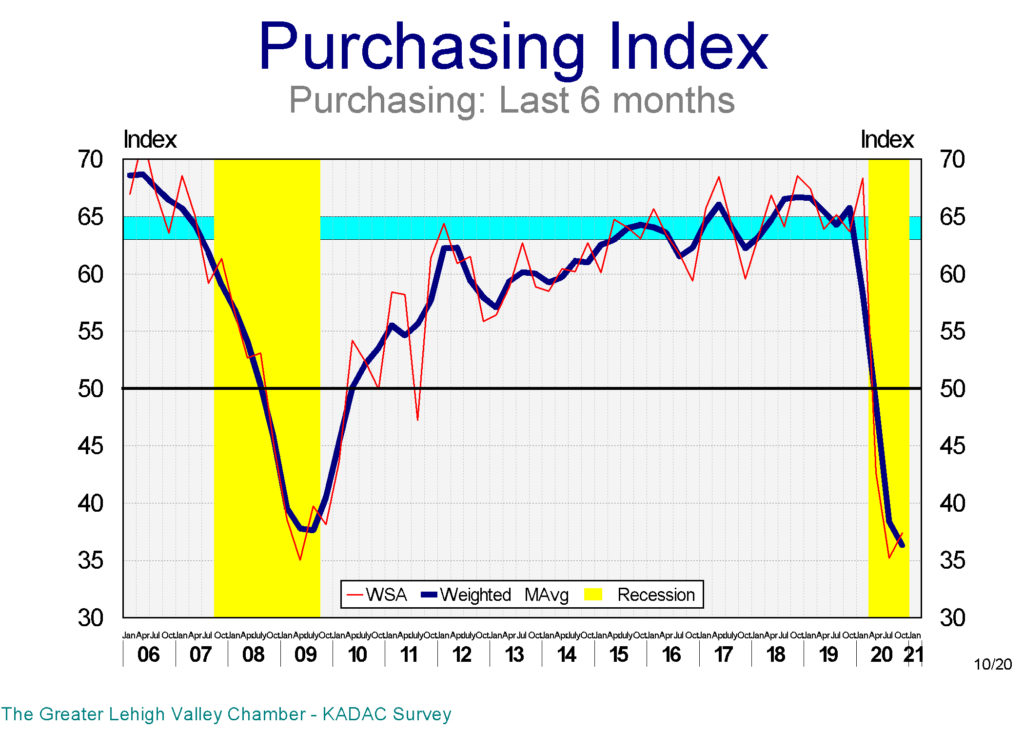
The index which has lost more than any other in our model over the last 12 months is the index of actual purchases, which fell to 42.6% below its January 2020 level. And its momentum is down from more than positive 200 in 2019 to around negative 300 in January 2021.
As was expected, the accommodation-food & leisure sector had the largest layoffs by far over the last 6 months, followed by construction and manufacturing.
The Finance-insurance sector led the plans for hiring over the next 6 months in January, followed by manufacturing and retail. And for the first time in almost a year, accommodation-food & leisure sector shows positive plans for future hirings.
Purchasing plans index dropped a slight 2.8% in January 2021, while actual purchases over the last 6 months rose by 4.9%. However, despite rising over the last two quarters, the index is still 42.6% below its January 2020 level.
The Valley has recovered/replaced 87% of all the jobs it lost in March and April of last year. And the finance and manufacturing followed by the accommodation-food & leisure sectors have the largest plans for expanding employment in the next 6 months.
And while all sectors except retail and real estate reported lower revenues over the last 6 months, the picture for the next 6 months is much more positive. And except for the accommodation-food & leisure and education sectors, none of the others expect their revenues to shrink in the next 6 months.

Our local business survey still shows a heightened level of concern with the future of the economy. However, we also observed positive signs among the local businesses regarding their hiring and purchasing plans for the next 6 months.
Lehigh Valley’s Inflation rate was 2.2% for 2020
Prepared by KADAC @ DeSales University
Director: Kamran Afshar, Ph.D.
Student Assistant: Brandon Reese
Lehigh Valley’s inflation rate in 2020 was 2.2%, according to the Kamran Afshar Data Analytics Center (KADAC) @ DeSales University.
During the 1980s and 1990s, the inflation rate in the Valley was often less than the national average. Between 2000 and 2007, the Valley’s inflation rate started to exceed that of the national average. Data collection was suspended between 2007 and 2017.
Data collection was restarted in 2018, with an updated basket of goods and services for the Valley. Lehigh Valley’s inflation rate was 2.2% in 2020, which is 0.9 percentage points higher than the 1.4% inflation at the national average. According to Lehigh Valley’s CPI, between December 2018 and December 2020, local prices have increased by 5.9%, compared to 3.7% at the national average.
Food prices rose by 5.5% in 2019 in the Valley, significantly higher than the national average of 1.8% for that year. In 2020, local food prices rose by 4.4%, a little higher than the national average of 3.9%. Fruits and vegetables, a sub-category of food, increased by 18.1% during 2019 and 2020; this is significantly higher than the national average of 1.8% during the same period. Another sub-category, food away from home, rose by 5.6% in 2019 and 7.0% in 2020, compared to 3.1% and 3.9%, respectively, at the national average.
In 2019 shelter costs in Lehigh Valley rose at a higher 5.3% in the Valley compared to the 3.2% at the national average. In 2020, the equation was reversed; the Valley’s shelter inflation rate was a negative 1.4% compared to a positive 1.8% at the national average. A 2.9% decrease in the sub-category of rent and rental costs in the Valley compared to a 1.9% increase at the national average was the most prominent cause of this rate divergence. Over the last two years, shelter costs in the Valley have increased by 3.9% compared to 5.1% at the national average.
Medical care costs in the Valley, rose at a faster pace than the national average, which is consistent with historical data.
Transportation costs rose by 0.8% in 2019 in the Valley compared to 1.9% at the national average. In 2020, Valley’s transportation costs rose 1.3%, compared to a drop of 2.4% at the national average. The main reason for this difference in 2020 was that motor fuel costs nationwide dropped more than those in the Valley.
One of the interesting flip-flops among the inflation rates that we observed in 2020 was the inflation rate of apparel, which historically has been negative or, at best, very low. Apparel costs in the Valley rose by 9.8% in 2020, after dropping 6.5% in 2019. Nationwide, however, apparel costs dropped in both years, resulting in a 5.1% drop compared to the Valley’s 2.7% rise for 2019 and 2020.
The rate of inflation rose by 5.8% during 2019 and 2020 in the Valley. During the same period, inflation at the national average was 3.7%.
CPI, or the consumer price index, reflects the change in the cost of an average urban basket of goods and services purchased by consumers. Higher inflation means prices are rising at a higher pace. And the price of almost all the items in the consumer basket of goods is based on their supply and demand. Since Lehigh Valley does not appear to be subject to any negative supply chain issues that push its prices up, the Valley’s higher inflation rate is most likely the result of relatively higher consumers in the Valley than the national average.
Lehigh Valley business sentiment index rose 6.4% in October
The Lehigh Valley’s business sentiment index the BSI made another small recovery in October, rising by 6.4%, similar to its 5.7% increase in July, after its historical 31.6% fall in April. Even after two increases, the October index rose to only 49.4, well below its January level of 64.2. And still below its average level during the Great Recession. The index’s improvement is underwhelming, too small, and reeks of a lack of enthusiasm from the Valley’s businesses participating in the survey.
Our October survey of Valley businesses was done before the release of the advanced estimate for the US economic growth, which shows a 33.1% increase in the 3rd quarter’s GDP, after an unexpected 31.4% drop in the 2nd quarter as the results of the Covid-19 and all the shutdowns. Despite the large percentage gain, since it was from a smaller base, the GDP rose to only 91.3% of its previous level, leaving us $670 billion short of its last year’s level.
In our Lehigh Valley model, the largest gain was for the new hires’ index in the last 6 months, which rose by 10.4% since July. Unfortunately, the index is still 26.6% below its last year’s level, even with that increase. Plans for future hiring did not show any measurable changes since July. Its index is still 8.5% below its last year’s level, and worse, the momentum for both hiring indices is negative and lower than any time even during the Great Recession.

The percent of local companies that reported net layoffs were around 5% during 2018 & 19, while the percentage of those with net hiring hovered close to 30%. These ratios have changed dramatically; in October, 27.1% of the participants in our survey had net layoffs, while only 15.5% of them reported net hiring. To simplify it, layoffs have increased by 5 fold, while hiring dropped in half.
As was expected, accommodation-food & leisure sector had the largest layoffs by far over the last 6 months. That dubious distinction still follows the sector as it also has led in layoff plans for the next 6 months.
Retail and other services sectors had the largest net hiring in the last 6 months, while manufacturing is the lead in hiring plans for the next 6 months.
Purchasing plans indices also rose in October; actual purchases recorded a 6.2% increase while plans for future purchases rose by 9.0%. However, to put these in context, actual purchases are still 41.3% below where they were last year despite the October increase. Plans for future purchases is in better shape and is only 12.3% below its last year’s level.
Accommodation-food & leisure sector also had the largest cutbacks in purchasing over the last 6 months. And they also lead the plans for cutbacks among other sectors over the next 6 months. The manufacturing sector leads the purchasing plans for the next 6 months.
It was a different story when it came to revenues; not everybody was in the same boat. While Real Estate companies reported very large increases in their revenues over the last 6 months, other sectors reported significant losses. The only exception was the professional and scientific sector, which reported a small increase in their revenues.
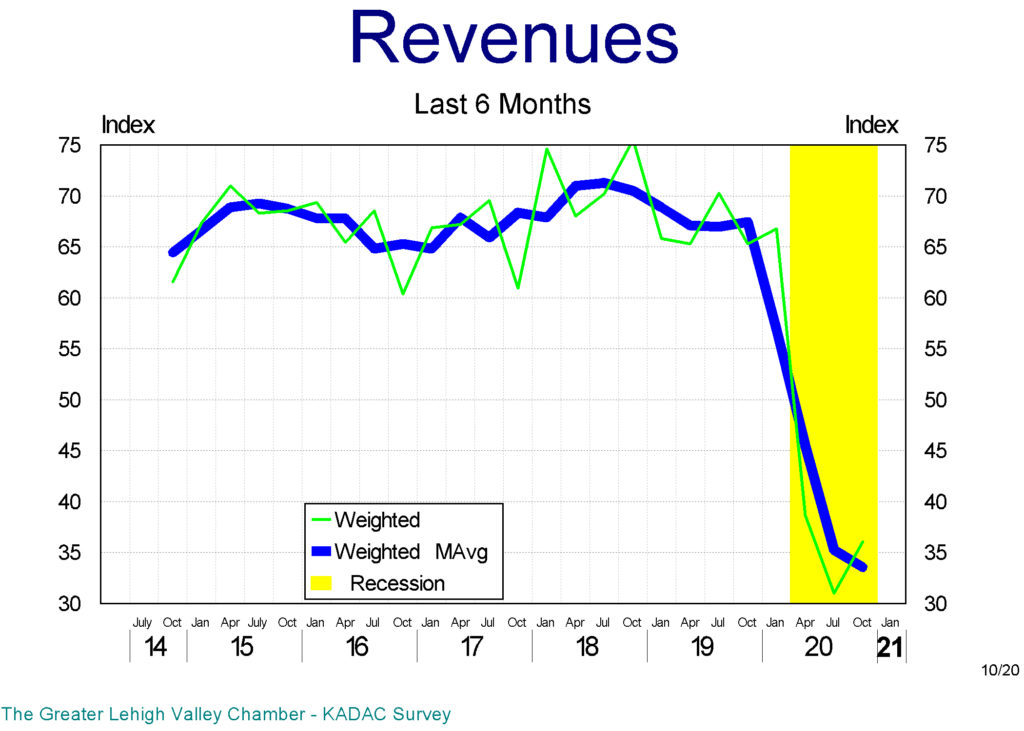
Healthcare leads the expected rise in revenues over the next 6 months, while accommodation-food & leisure sector still expects large drops in their revenues.
The economy reclaimed a good 91% of its losses during the 2nd quarter, however, it is still well below its last year’s level. The most common question is; was the 3rd quarter growth the start of a V-shaped recovery or the end of the first up-tick inside a W-shaped recovery. Which translates to, is this the start of continuous recovery, or are we in for a second drop in the GDP.
Our local business survey clearly shows a heightened level of concern with the future of the economy. We did not observe any of the common signs when enthusiasm about the future counters fears of the present and usually results in sustained growth, something that was part and parcel of all previous recoveries.
This time around, businesses are not setting-up for recovery, it looks like they are more concerned with further risk reduction.
The results of the 2nd KADAC 2020 General Election poll
This is the second of two DeSales University – WFMZ polls to be released before the general election on November 3rd. This poll is to be released on Monday October 26, 2020. The survey data was collected between October 11 and 24 and includes the responses of likely voters residing in Pennsylvania’s 7th congressional district. This area includes all of Lehigh and Northampton counties, as well as portions of Monroe County. The survey and subsequent analysis was conducted by the Kamran Afshar Data Analytics Center (KADAC) at DeSales University.
The results reported here are based on live telephone interviews of 448 likely voters (279 cell phones and 169 landlines). Respondents were selected through a randomized database of registered voters in the district. A weighting measurement has been used to make sure the survey is representative of the relative number of registered voters in each of the three counties in the 7th district. The margin of error for the survey is+/- 4.4% at a 95% level of confidence.
Our sample includes more Democrats (48%) than Republicans (37%), which resembles the breakdown of actual voter registration data in the district. However, only 30% of these voters identify as liberal while 35% reported that they are conservative. President Trump’s approval rating dropped to 36% from 40% in our first poll, mirroring the drop in his approval of his response to the COVID-19 pandemic, which dropped slightly from 35% to 32%. Governor Tom Wolf’s scores on both accounts remain high in the 7th district. 55% of likely voters approve of the job he is doing as governor, and 58% approve of how he has dealt with the pandemic specifically.
Turning to the election on November 3rd, voters signal stronger support for Democratic candidates. These findings are bolstered by evidence of higher engagement from Democrats during the early voting period In Pennsylvania, where 70% of the already returned ballots have come from registered Democrats. According to the U.S. Elections Project, run by Michael McDonald at the University of Florida, nearly 97,000 votes have already been cast in the three counties we cover as of October 23rd.
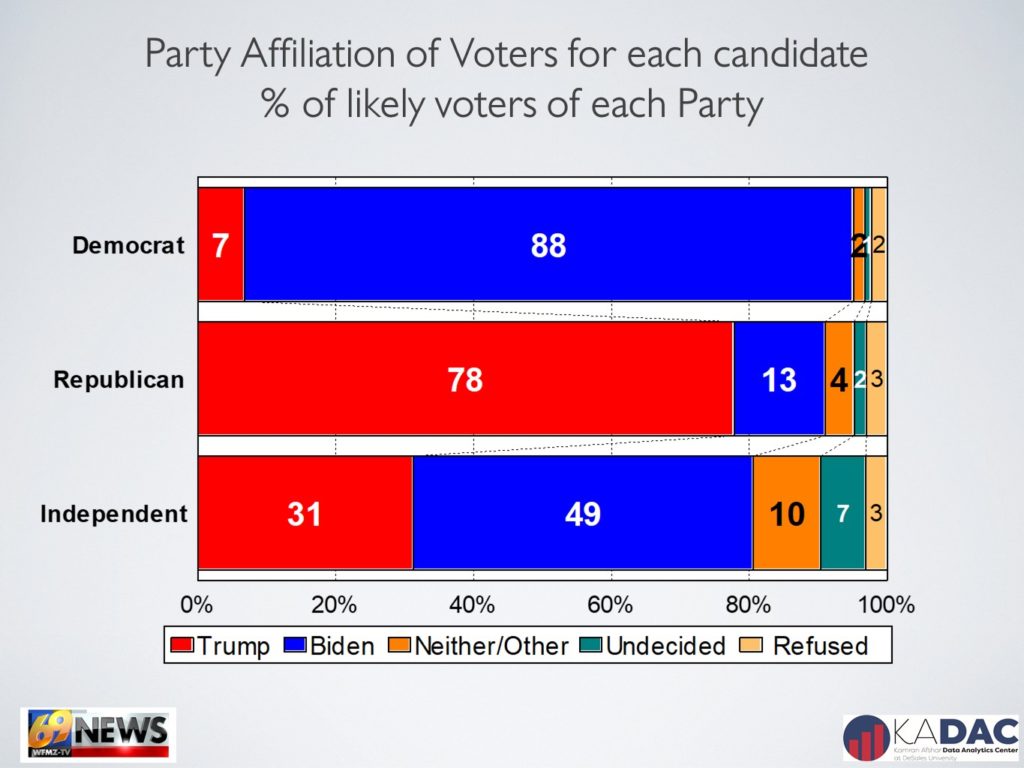
In one of the two federal elections on the ballot, we have seen movement towards former Vice President Joe Biden since our last poll, giving him a lead of 56%-37% over President Donald Trump, an increase of 4 points since our previous release two weeks ago. We have also seen some movement towards President Trump solidifying his Republican base, as 81% of Republicans in this poll indicate they will vote for the president, up from 76% previously. But he still trails Biden in partisan support, as 91% of Democrats say they will vote for him. In the race to represent the 7th district in the House of Representatives, the current representative, Democrat Susan Wild leads her Republican challenger Lisa Scheller 54%-35%, which is nearly identical to the 54%-36% spread in our last survey.
We have also seen a slight uptick in voters’ reported willingness to take a government approved vaccine in 2020 since the last poll. 45% of respondents said they would be willing to take such a vaccine. But we have also seen an increase in the opposition to take a vaccine, with 38% of likely voters reporting that they would not take it. In our first poll, 41% indicated they would take it and 36% said they would not.
To determine the sample of likely voters, we only include registered voters in the 7th district of Pennsylvania who described themselves as either “very likely” or “somewhat likely” to vote in the upcoming general elections. The survey was designed by faculty at DeSales University in Center Valley, PA in conjunction with WFMZ. The poll was funded entirely by KADAC and WFMZ.
The results of the first KADAC poll in 2020
This is the first of two DeSales University – WFMZ polls before the general election on November 3rd. This poll was released on Tuesday October 13, 2020. The survey was conducted between October 2nd and 10th and includes the responses of likely voters residing Pennsylvania’s 7th congressional district, which includes all of Lehigh and Northampton counties, as well as parts of Monroe County and was conducted by the Kamran Afshar Data Analytics Center (KADAC) at DeSales University.
The results reported here are based on live telephone interviews of 466 likely voters (294 cell phones and 172 landlines.) Respondents were selected through a randomized database of registered voters in the district. A weighting measurement has been used to make the survey is representative of the relative number of registered voters in each of the three counties in the 7th district. The margin of error for the survey is +/- 4.3% at a 95% level of confidence.
According to the results of those who are likely to vote is as follows:
Participants in our sample identify themselves as slightly more conservative than liberal, while more Democratic than Republican. Our data shows a correlation between educational attainment and enthusiasm to vote in this general election.
Among likely voters participating in our survey, 40% approve of President Trump’s handling of his job, while 54% disapprove. Another 6% neither approve nor disapprove. 55% approve of Tom Wolf’s performance as governor, while 38% disapprove, and 7% neither approve or disapprove. Additionally, only 35% of respondents approve of President Trump’s response to the COVID-19 pandemic, while 59% approve of Governor Wolf’s response.
Former Vice President Joe Biden holds a 15-point lead (54%-39%) over President Donald Trump among likely voters. 86% percent of those who voted for Donald Trump in 2016, are planning to vote for him again in 2020. 96% of those who voted for Hillary Clinton 2016 are planning to vote for Joe Biden in 2020. Among those who voted for someone else in 2016, 20% are planning to vote for Trump and 45% for Biden. Among those who didn’t vote in 2016, 36% are planning to vote for Trump and 43% for Biden.
Representative Susan Wild has a lead of 18 points (54%-36%) over Lisa Scheller, with particularly heavy support among higher educated likely voters. 85% percent of Democrats 19% of Republicans are planning to vote for Wild, while 71% of Republicans and 7% of Democrats are planning to vote for Scheller.
Registered voters in the 7th district are almost evenly divided among those who will not get a government approved vaccine before the end of this year and those who would, with 41% of respondents indicating they would take such a vaccine and 36% saying they would not. And even taking or not taking the vaccine was also highly political; 37% of Democrats vs. 50% of the republican stated that they take the vaccine, if available before the end of this year. Independents resembled the Democrats more in this case as only 36% of them stated that they will take the vaccine by the year’s end.
Quarterly Economic Review of Lehigh Valley Businesses: 2020 Q3 LV Discourse @ WDIY
How are the Lehigh Valley’s businesses doing? Dr. Kamran Afshar welcomes guest Tony Iannelli, CEO and President of the Greater Lehigh Valley Chamber of Commerce, to discuss the results of the latest quarterly economic survey of Lehigh Valley businesses.
Lehigh Valley business sentiment index rose 5.7% in July
The Lehigh Valley’s business sentiment index the BSI made a small recovery in July, rising by 5.7% after its historical 31.6% fall in April. The index is still below its average level during the Great Recession. The small July recovery could be either the start of a directional change or just a bounce.
The July survey revealed some interesting decision-making dilemmas facing businesses; for example, the largest losses and gains in July were among the purchasing indices; the index of plans for future purchases rose sharply, however, since it was from an all-time low, it is still 19% below its January level. On the other hand, the index of actual purchases over the last 6 months, continued to drop, falling to half of its January 2020 level.
Businesses, clearly are not buying, nor planning to raise their purchases close to where it was before Corona.
The percent of local companies which reported net layoffs, was 5% during 2018 & 19, while the percentage of those with net hiring hovered close to 30%. In January 2020, before the impact of COVID, we observed a significant change; percent of businesses with net layoffs almost doubled, while the percentage of those with net hiring dropped. By April, the percent of companies with net layoffs had tripled, while the percent of those with net hiring was almost halved. This negative trend became even worse in July.
Our employment indices also moved in opposite directions, the index of actual hiring over the last 6 months, continue to fall through July to all-time low. On the other hand, the index of plans for future hiring recorded a small increase indicating that businesses have started to plan for future hiring.
The index of actual revenues over the last 6 months fell to less than half of where it was in January, while expected future revenues, rose sharply in July, it is still well below its January level. Some business optimism is coming back, but in trickles.
All of the indices in our model are still well below where they were in January.
Most economists still believe that the 3rd quarter would witness the start of the recovery. How fast or slow that recovery will be, has very little to do with how fast or slow states open businesses or if children attend school in person. All of it, however, depends on how safe people feel in going out of their homes, going shopping, or even thinking of maybe visiting a restaurant! That kind of feeling does not come from wishful thinking and cannot be manufactured; for it to sustain, it has to be real. Our economic recovery is directly related to the rate at which we can bring this pandemic under control.
Lehigh Valley’s inflation was 3.6% in 2019
Lehigh Valley’s inflation rate in 2019 was 3.6%, according to the Kamran Afshar Data Analytics Center (KADAC) @ DeSales University Consumer Price Index.
Lehigh Valley’s inflation rate rose by 3.6% in 2019, higher than the 2.3% at the national average. The higher inflation in the Valley is mostly due to the sharper rise in food and shelter costs compared to the national average.
Food prices increased by 5.5% in the Valley, compared to 1.8% nationwide in 2019. In both the Valley as well as the national average, the increase in the overall food prices was mostly due to the sharper rises in the sub-category of meats, poultry, fish, and eggs. In the Lehigh Valley.
The cost of Shelter in Lehigh Valley also rose at a higher rate of 5.3% compared to 3.2% at the national average. This was mostly influenced by a 5.8% increase in rent and rental costs in the Valley compared to 3.3% at the national average.
On the lower side, Apparel costs dropped by 6.5% in the Valley compared to a drop of 1.2% at the national level. Lehigh Valley transportation costs rose at a slower 0.8% rate compared to 2.0% at the national level.
This is the first in a series of continuing reports on the Lehigh Valley CPI, from KADAC @ DeSales University. Future updates will be provided on a semi-annual basis.
Lehigh Valley business sentiment index crashed to historically low levels
In April, the Lehigh Valley Business Sentiment Index, the BSI, dropped 32% below its January 2020 level.
The LV BSI is based on the Greater Lehigh Valley Chamber of Commerce-Kamran Afshar survey of the Valley businesses done on a quarterly base since 1998.
The Valley’s business sentiment, which had already given up a year’s worth of growth during 2019, gave up 10 years of gradual climb in April 2020, falling to 43.9, almost a point below its lowest level during the Great Recession.
Our employment indices were dropping since the middle of last year. In April, the index of actual hiring in the previous 6 months, followed its 5% drop in January with an alarming 24% drop. While the Valley’s unemployment rate vaulted out of a tight labor market lows into a high unemployment environment, it was already on the way up well before April. It bottomed out last June at 4.2% and then started to rise and was already close to 5% before jumping to 6%, and we predict it will exceed 15% in April on its way up. It is not just that the tight labor market is over; the unemployment rate is expected to rise to historically high levels.
The percent of local companies which reported layoffs, was 5% during 2018 & 2019, while the percentage of those which were hiring hovered close to 30%. In January 2020, we observed a significant change; percent of businesses that were laying off almost doubled, while the percentage of those which were hiring dropped. And in April, the percent of companies laying off tripled, while the percent of those hiring was almost halved.
Our purchasing indices, both actual and planned, had large losses, dropping by more than 40%. Unlike the hiring indices, the purchasing indices were not dropping before April 2020, and now they are falling twice as fast as the hiring indices. The revenue indices dropped by 50%. And to add insult to injury, it is the index of expected revenues over the next 6 months, which has dropped significantly worse than actual revenues over the last 6 months.
The future thankfully is not as dark, and while there are more than the usual number of companies that are planning further layoffs, there are also almost twice as many who are planning to hire.
The Lehigh Valley’s data indicate that we are in a very sharp recession, the economic cycle is expected to be U-shaped, with recovery starting in the 4th quarter and hopefully getting legs in the 1st quarter of 2021.