


Category Archives: KAA Blog
The number of housing starts in the Valley has collapsed. What does this mean for the future of our housing market?
Housing starts which is a short-term leading indicator of the housing market used to run at around 400 new starts a month during the boom years of 2004 – 2005 in the ABE metropolitan statistical area (ABE MSA). When the bubble bursted, the number of new housing starts crashed from 400 all the way down to around 100 by 2008.
That was the Great Recession and the expectations were that as soon as things get back to normal, housing starts will also move back up to its previous levels.
Well, it didn’t work exactly that way. Housing starts in the Valley continued to drop, albeit at a much slower pace all the way through 2011 falling to 75 new starts a month in the ABE MSA.
After 2011 things started to look better and the number of starts rose slowly to 100 by middle of 2013. It looked as if the long awaited recovery in the new starts in the ABE MSA had started. Of course we didn’t expect the 400 new starts of 2004 -2005 period because that was during the bubble. The expectations was to get to around 150 new starts a month, which, of course, didn’t happen. And that was not all, from the middle of 2013 the new starts, instead of continuing to go up, started to slowly ease down. By summer of 2014 we were at around 90 new starts a month.
Totally contrary to expectation, since the economy was doing better, mortgage rates were still very low and number of housing sales in the Valley was continuing up.
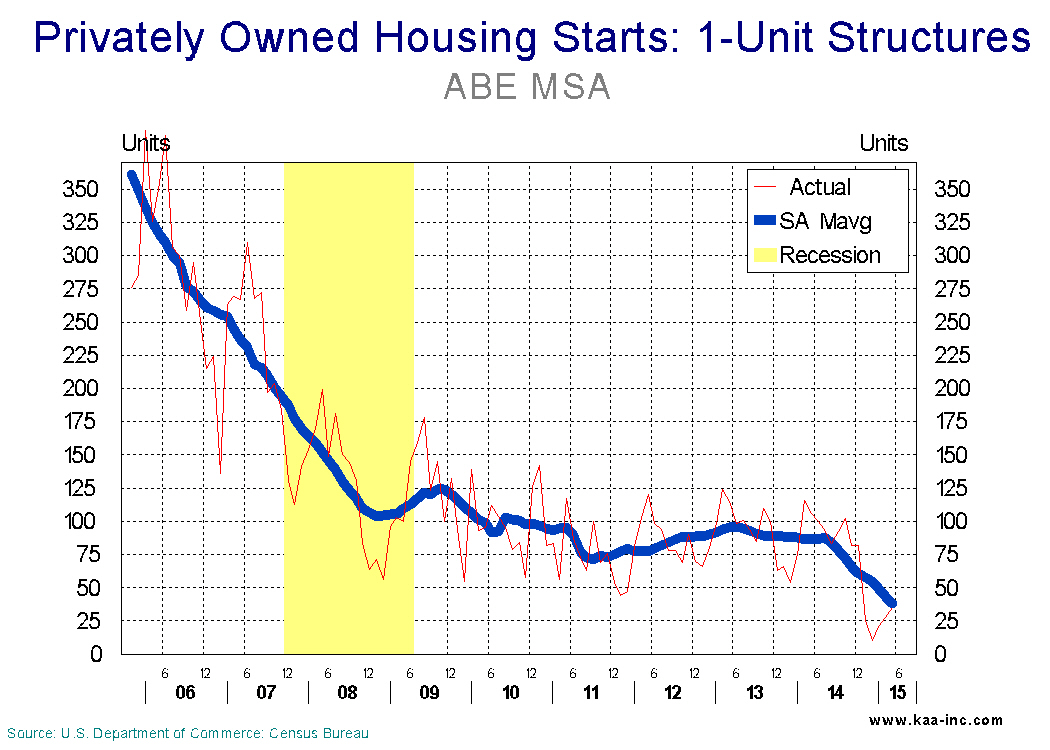
The housing starts dropped to 90 by summer 2014. And as if that was not enough of a puzzle, the number of new starts in the Valley then crashed all the way down to 35 by May 2015. It should be noted that the average number of new starts in the Valley for the month of May in the last 6 years was 109. For the period we call the “normal” that is most of the 1990s, average number of new starts in the month of May was 190 in the ABE MSA. Also, at the national average, the number of new building starts has been rising since 2010.
The total number of new housing starts in the ABE MSA for the first 5 months of this year is 119, less than a third of 417 new starts during the same period of 2014. And to add insult to injury at the national level during the same period of this year, the number of new starts has increased by 7.1% above its 2014 level. New starts at the national level has been rising since 2011.
A precursor to new starts is building permits, this indicator has also been falling since 2013 in the ABE MSA. The number of deeds registered is a long term predictor of the housing market, this indicator also dropped in 2013, but has recovered its losses this year.
The data clearly indicates that the number of new houses built in the ABE MSA has dropped dramatically in the last 12 months, and data from permits indicates that this trend may not reverse itself in the next few months. While this may be good news for those who have their houses on the market, since it means fewer brand new houses are being built to compete with the existing houses on the market, for the overall economy it is a cause for concern!
LV’s Business sentiment index at its highest level since before the Recession
The Kamran Afshar- Greater Lehigh Valley Chamber of Commerce survey of Lehigh Valley businesses is done on a quarterly basis and collects about a thousand observations per year. The Employment and Purchasing Index for the Lehigh Valley highlights the results of these surveys.
In April 2015 we conducted our 62nd survey of this series which recorded continued optimism in the local economy.
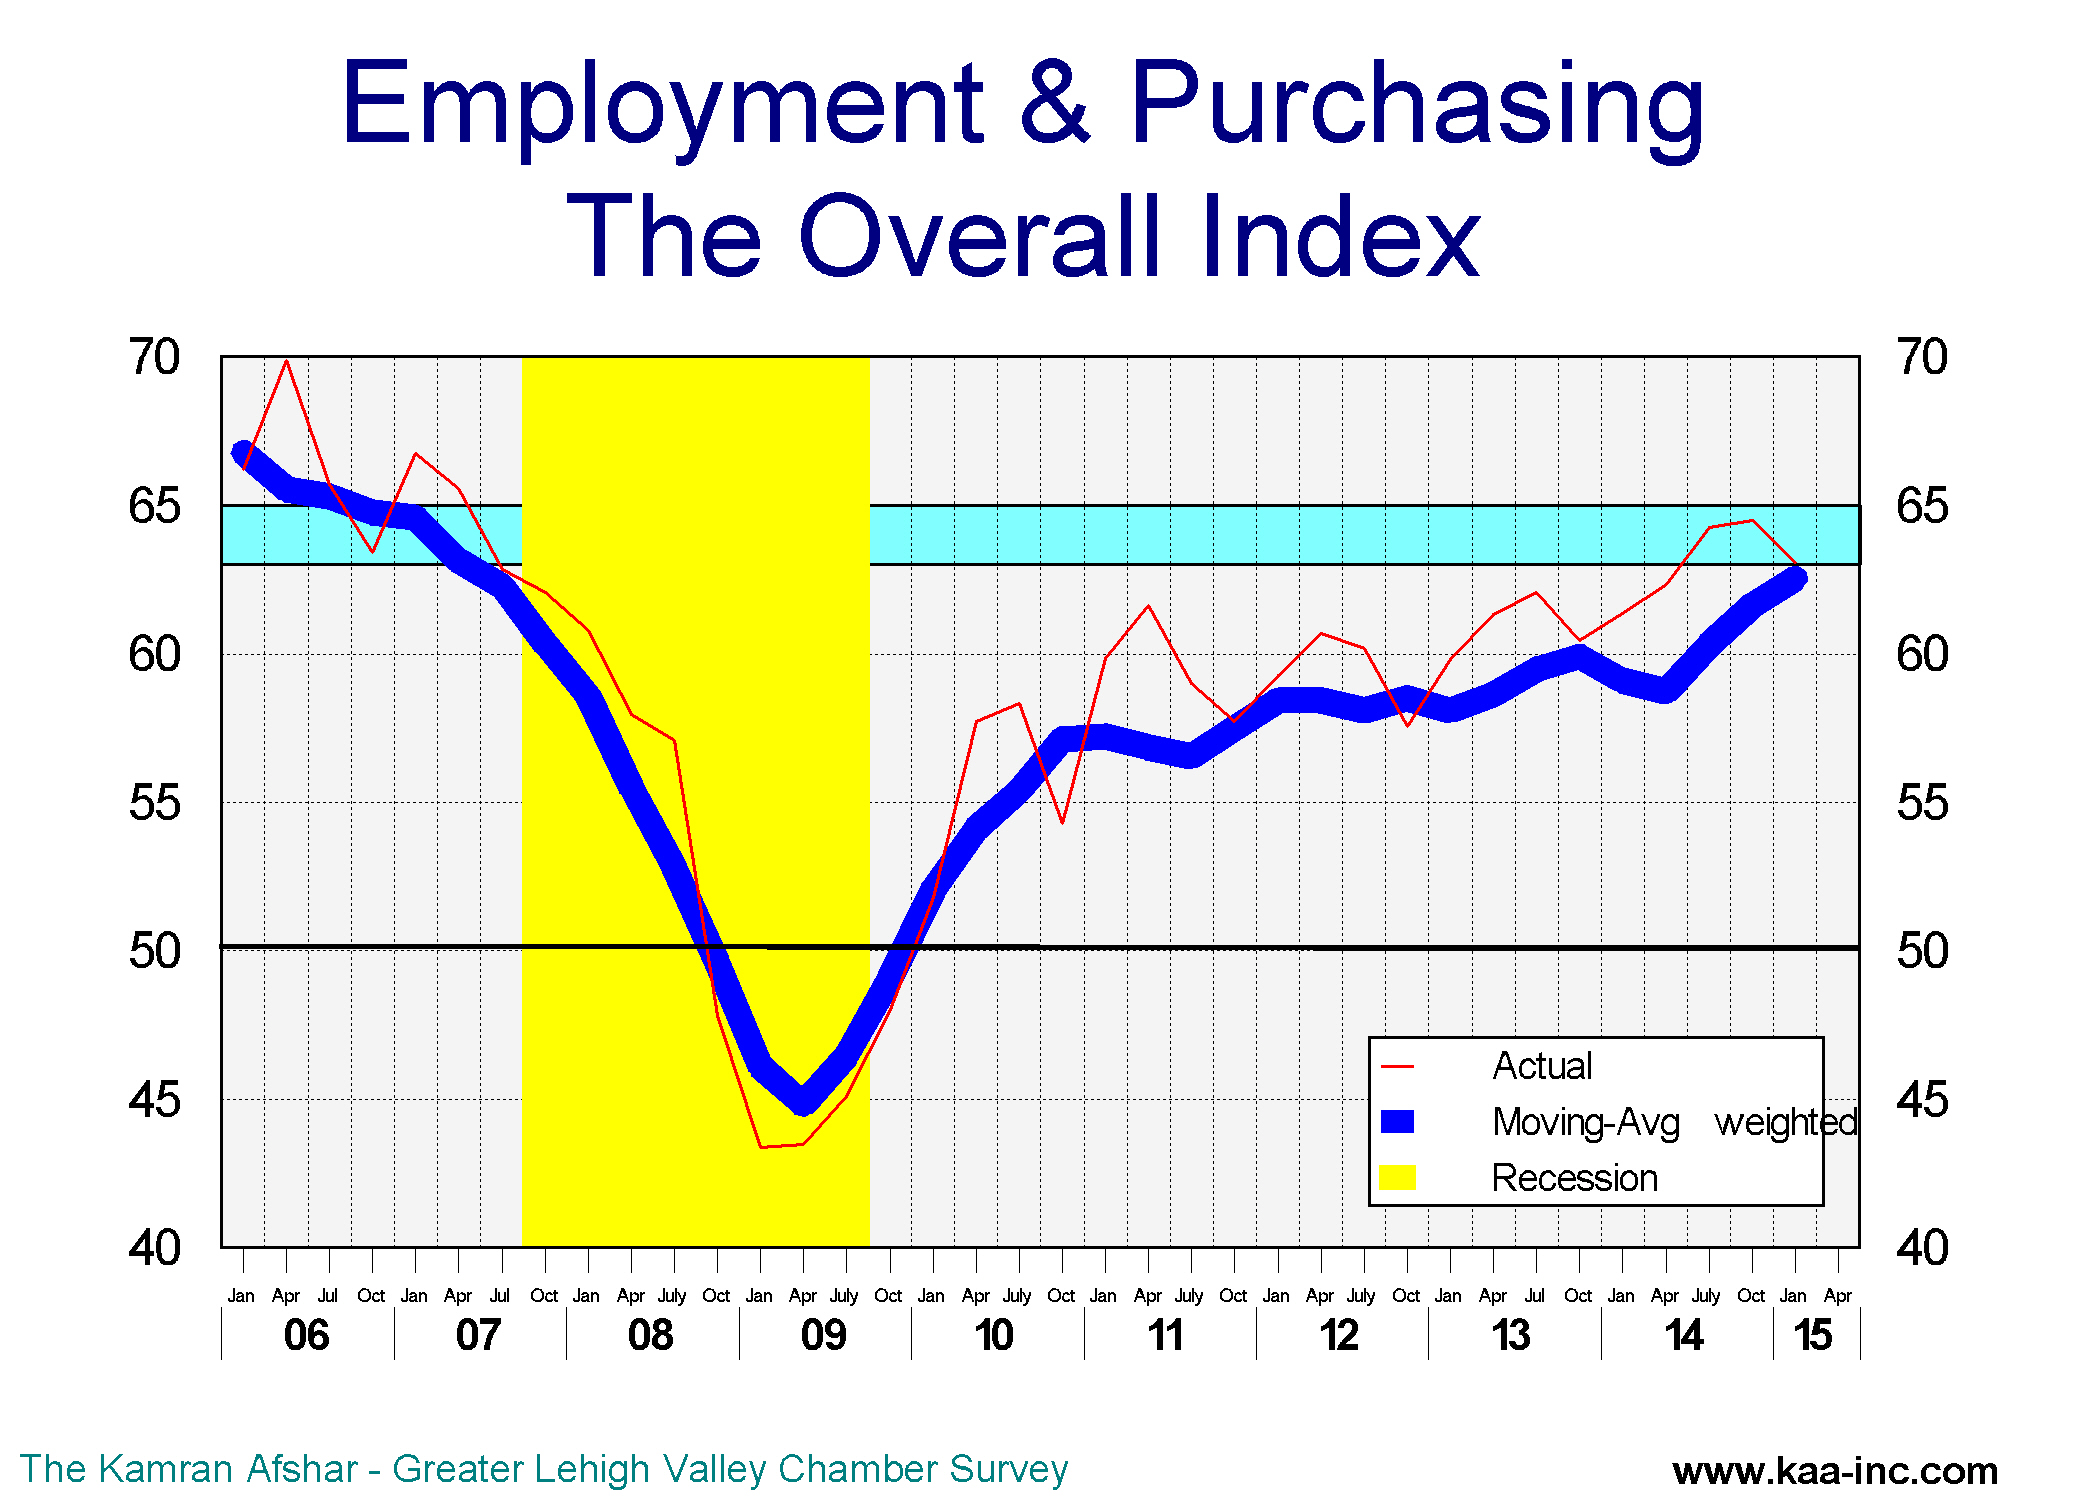
Business sentiment, as measured by the overall index rose slightly to 62.4 in April, while slightly above its January level, it was a significant 7.6% higher than its April 2014 level. It should be noted that the highest level for the index, 68.5 was reached in April 2006. The index then fell to 44.4, its lowest point in April 2009. Right now at 62.4, the index its at its highest level since April 2007.
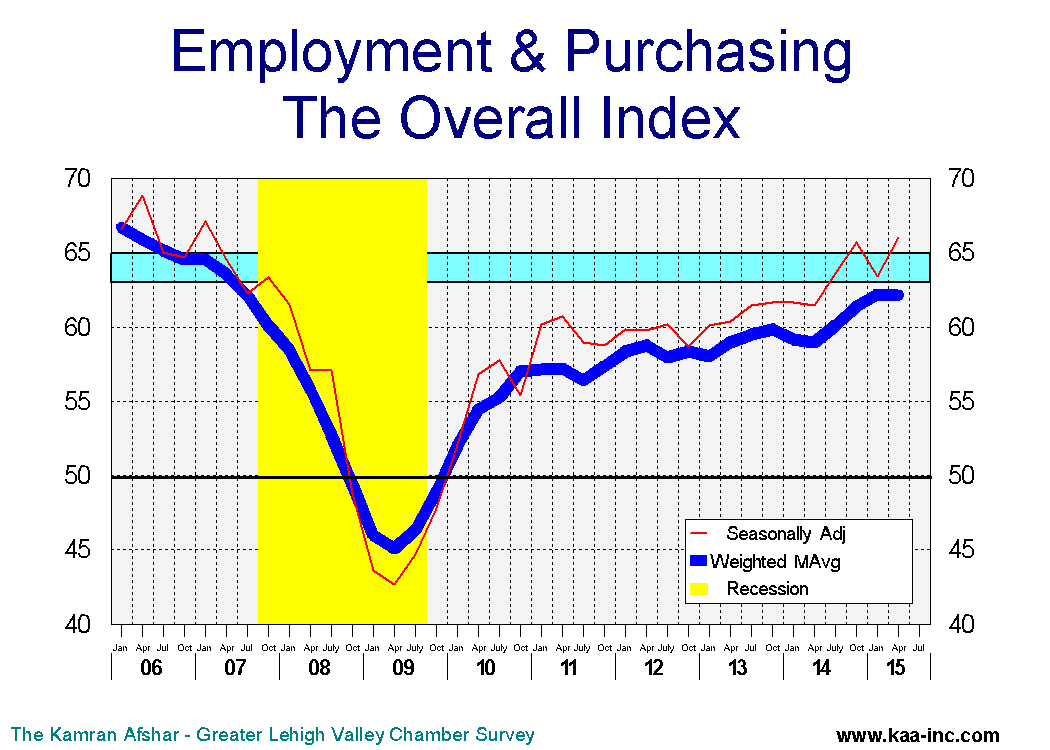
The largest gain in the last 12 months was in the index of planned purchases for the next 6 months. This index soared by 16.6% over its last year’s level. And its trend is now at its highest level since 2007. This index is moving into the range which was historically associate with expansion for the Valley.
Another index which also recorded a significant 7.9% increase over its last year’s level is the index of actual expenditures over the last 6 months. This index, while rising, is still shy of the expansion range for the Valley.
The two expenditure indices, both actual and planned are both moving up.

The trend for the hiring index during the last 6 months moved into the expansionary range in April. Twenty-five percent of the respondents to the survey indicated that they had net addition to their employment over the last 6 months, while only 8% reported net losses in the Lehigh Valley. During prospers economic times around 25 to 30% of the participants show net gain while 8 to 10% show net loss. We are closing in.
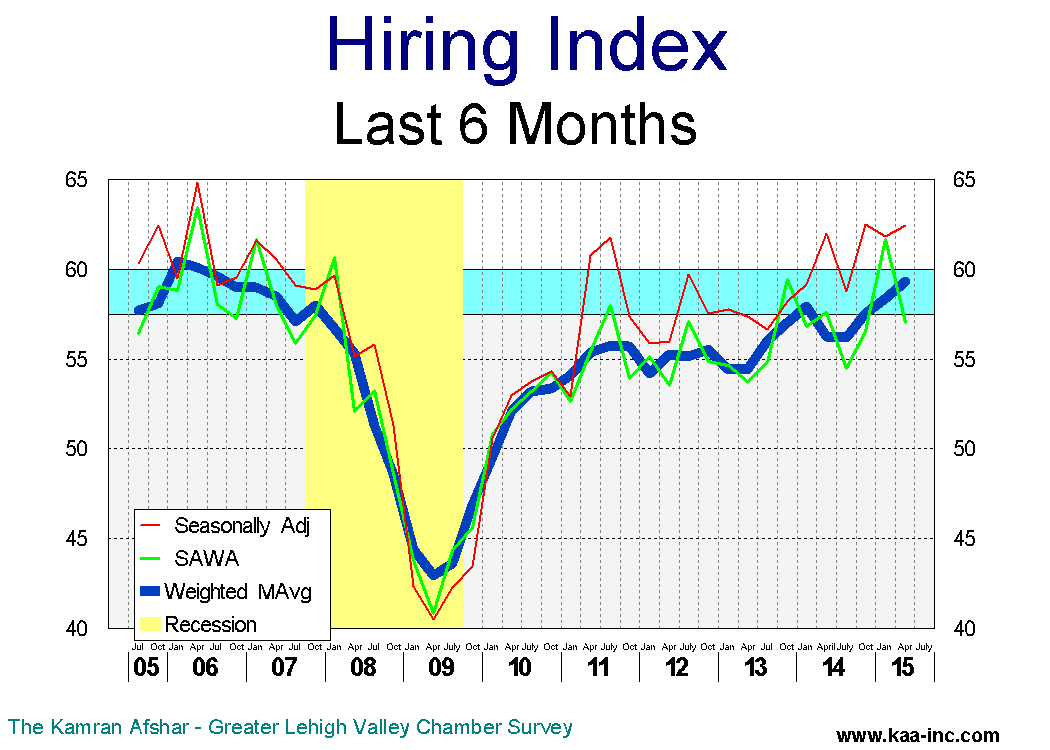
The average business participating in the survey hired 0.8 new employees in the last 6 months. This compares to hiring around one employee in the pre-recessionary years. It should be noted that during the Great Recession, local businesses were laying off 0.8 employees. So this is not only a significant improvement compared to the depth of the recession, it is closing in on the pre-recessionary hiring levels.
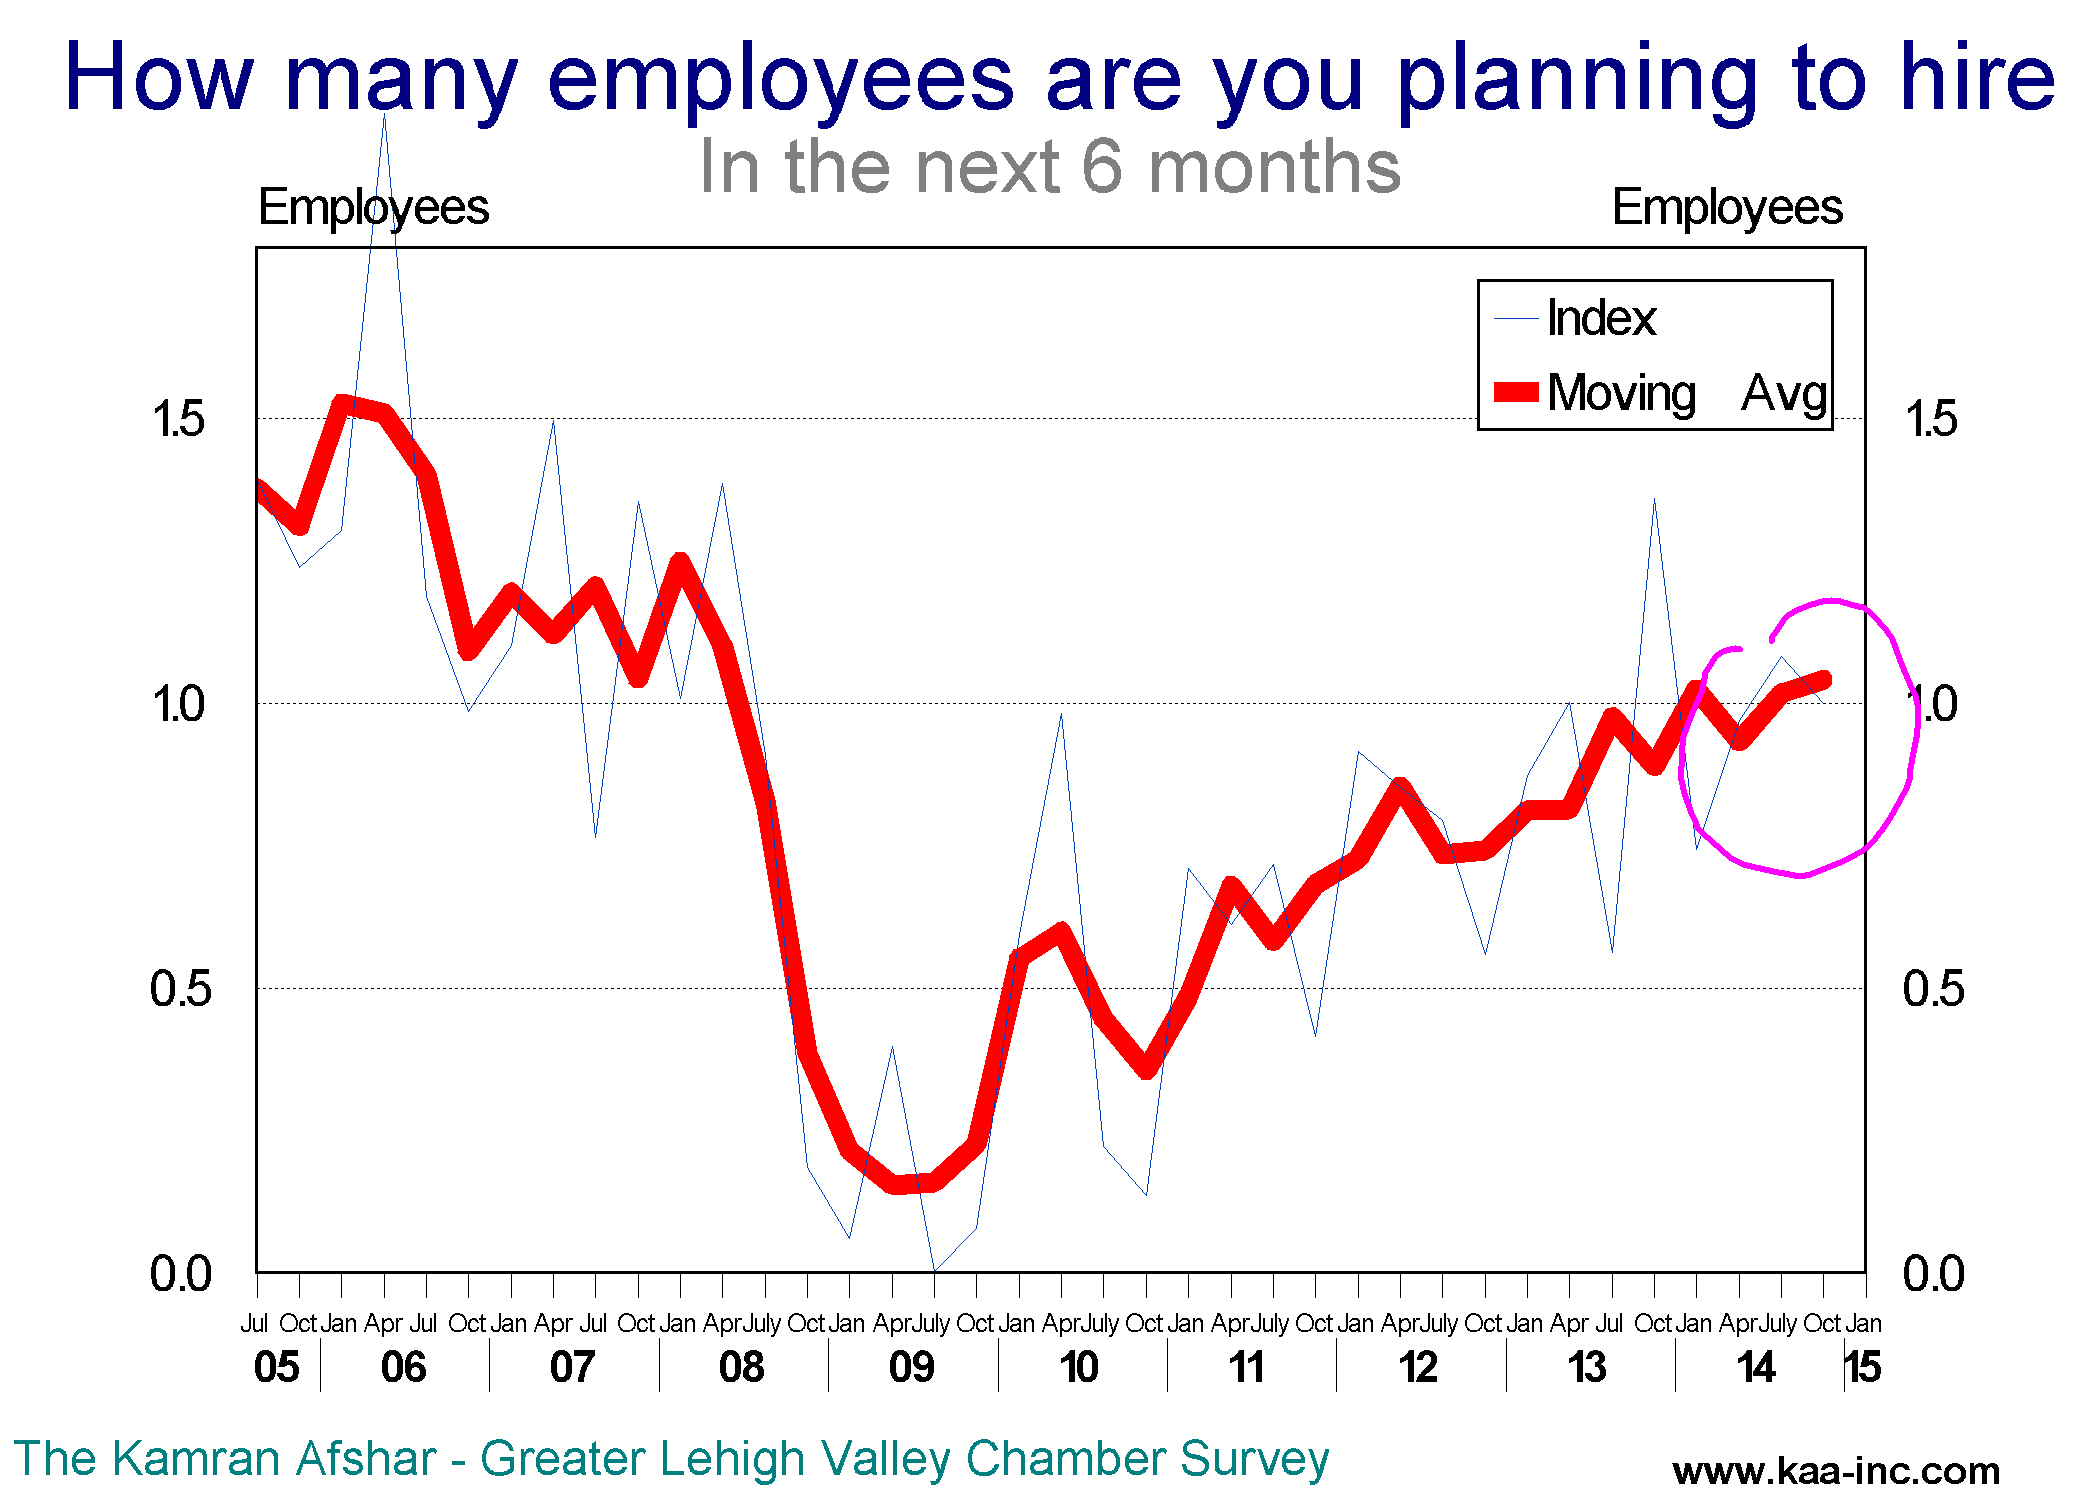
More than a third of local businesses are planning to hire more people in the next 6 months, while only 2.4% of the participants planned to lay off people. Average participant in the survey is planning to hire 1.2 new employees in the next 6 months. This is the highest level for this index since the recession. Local businesses have raised their future hiring plans to above one employee since last July.
Local businesses’ actual and planned expenditures are starting to come closer to their new hiring plans. There was a while, particularly in 2014 when we initially saw hiring plans increase without the requisite increase in the plans for spending. That problem appears to have been solved.
Fifty-eight percent of the businesses participating in our April survey reported
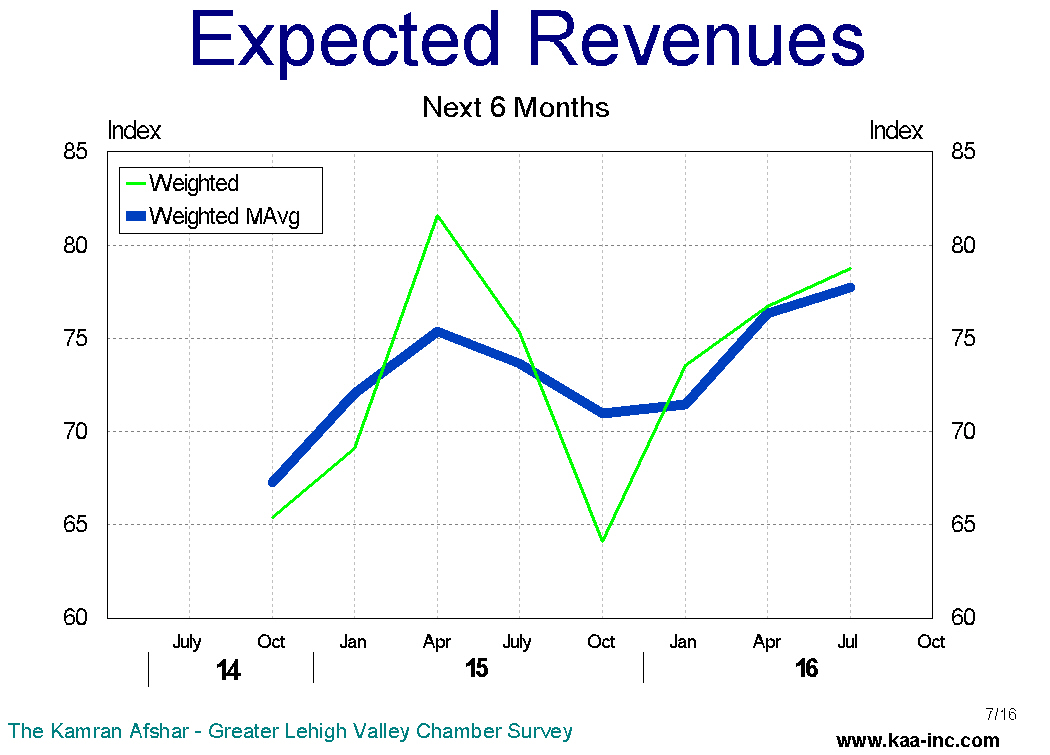
increases in their revenues over the last 6 months, while 16% reported decline in theirs. Looking into the future, a much larger 71.5% expect their revenues to be higher while only 8.3% expect to see lower revenues.
Based on the results of our April survey we expect the Valley’s economy to show real growth over the next 6 months. Companies with more than 21 employees are expected to show significant increase in their employment levels and will lead the expansion, growing at a higher rate than others.
Overall employment is expected to continue to show higher growth rate over the next 6 months.
February’s inflation was 0.2%
February’s 0.2% inflation was mainly caused by higher food and energy price as well as increases in shelter costs. However, thanks to lower oil prices, inflation over the last 12 months was 0.0%.
PMI Jan 2015
Local hiring index at its highest level since before the Recession
The Kamran Afshar- Greater Lehigh Valley Chamber of Commerce survey of Lehigh Valley businesses is done on a quarterly basis and collects about a thousand observations per year. The Employment and Purchasing Index for the Lehigh Valley highlights the results of these surveys.
In January 2015 we conducted our 61st survey of this series which recorded continued optimism in the local economy.
Business sentiment, as measured by the overall index stood at 61.5 in January, while slightly below its last October’s level, it was a significant 4.4% higher than its January 2014 level. It should be noted that the overall index spiked upwards in October, and despite its drop, it is still above its July 2014 level. And the moving average of the index has now reached its highest level since July of 2007.
The largest gain in January was in the index of actual hiring over the last 6 months. This index soared by 8.4% over its last October’s level. This is also the highest level for this index since January of 2007.
The average business participating in the survey hired 0.7 new employees in the last 6 months. It should be noted that even during the beginning of the recovery, local businesses were hiring only around 0.4 employees. This part of the index, that is “how many people did you hire in the last 6 months” rose by 8.4% in January, after a 13.7% increase in October of 2014. This index is now running very close to its 2005-2006 levels during the Valley’s last economic boom.

And close to a third of local businesses are also planning to hire more people in the next 6 months. Average participant in the survey is planning to hire 0.9 new employees in the next 6 months. Local businesses have raised their future hiring plans close to one employee since the beginning of 2014.
Our local employment picture has remained positive for the last 3 quarters, something we haven’t seen since before the Great Recession.
Despite of the very bright hiring picture, local businesses trimmed down their actual expenditures as well as their plans for future expenditures in January, dropping both indices below their October levels. Although it should be noted that both these indices recorded upward spikes in October. And despite their January drop, they are still above their last July’s levels, and both of their trends are clearly moving up.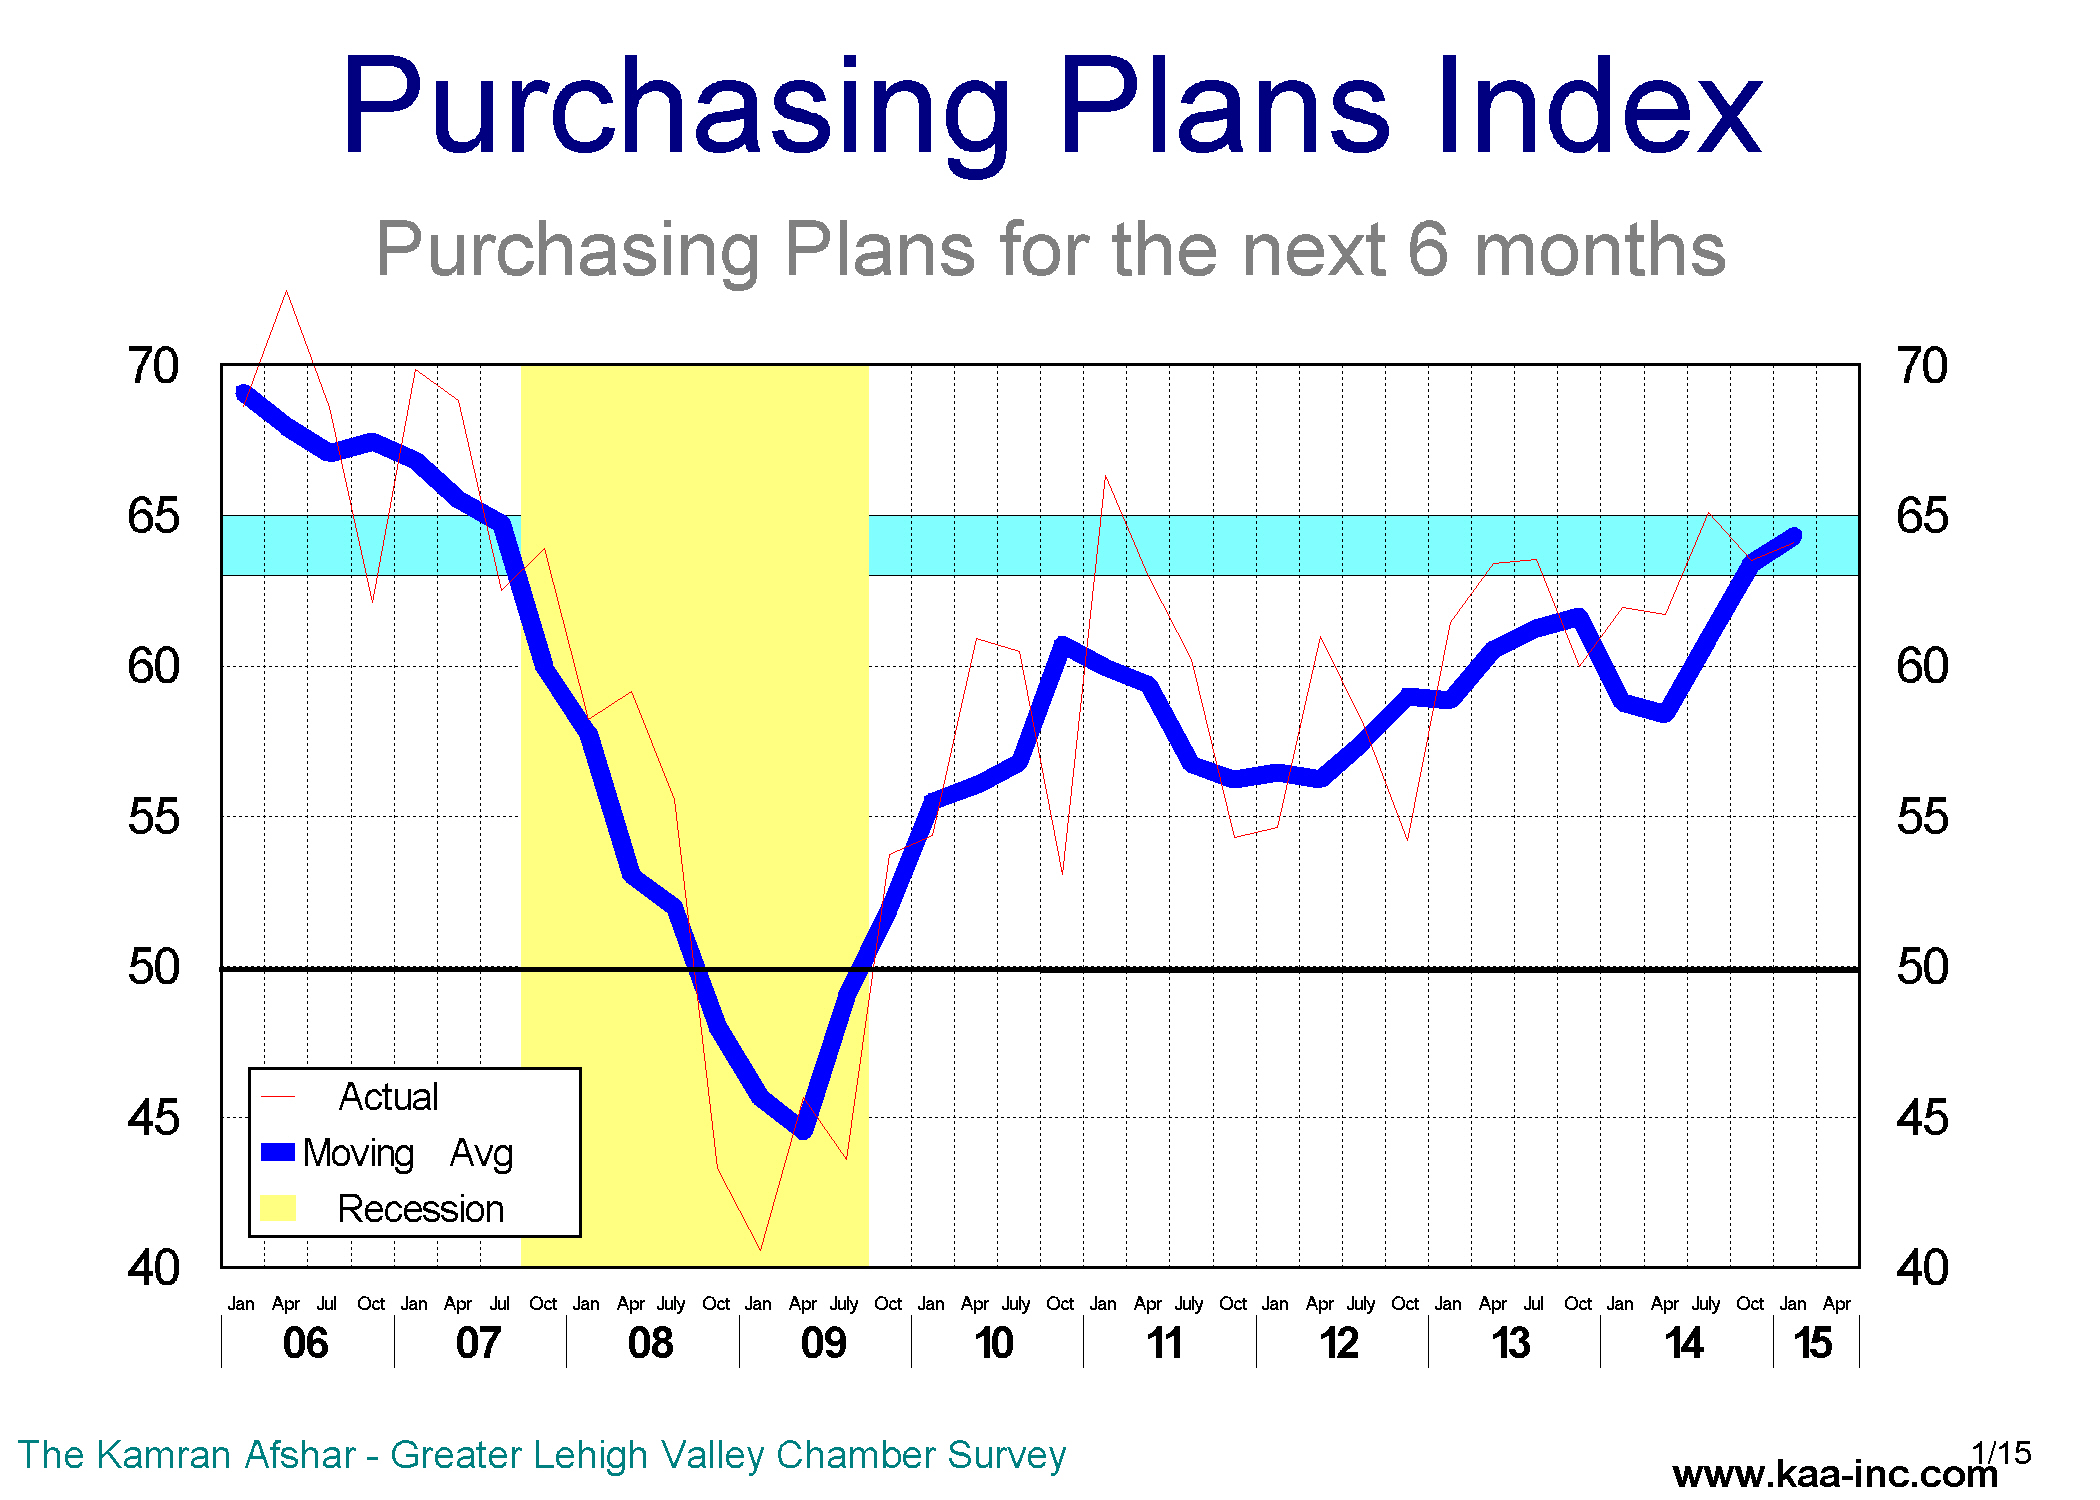
Businesses participating in our January survey experienced an increase in revenues in the last 6 months and expect their revenues to increase further more over the next 6 months.
Based on the results of our January survey we expect the Valley’s economy to show real growth over the next 6 months. Companies with 51 to 100 employees will lead the expansion, growing at a higher rate than others. And employment is expected to continue to show higher growth rate over the next 6 months.
Business sentiment up in October 2014
The Kamran Afshar-Greater Lehigh Valley Chamber of Commerce survey of Lehigh Valley businesses is regularly conducted on a quarterly basis and about 800 observations are collected per year. The Employment and Purchasing Index for the Lehigh Valley highlights the results of these surveys.
In October 2014 we conducted our 60th survey of this series which recorded an increase in optimism in the local economy.
Who do we survey? We survey businesses large and small and in a variety of different lines of business; around a third of our respondents are businesses with less than 6 employees. Four out of every 10 respondents have between 6 and 50 employees and a quarter of them have more than 50 employees.
Business sentiment, as measured by the overall index rose to 63.6 in October 2014, a significant 6.4% increase over its July 2014 level. The index has now reached its highest level since 2007.

The index shows the percent of businesses whose business sentiments are positive. Accordingly, any index above 50 means that more than half of the participants were positive about the economy. The October overall data shows around 64% of the participants were positive about the economy.
The largest gain in October was in the index of actual purchases over the last 6 months. This index soared by 9.9% over its July level. This is also the highest level for this index since the 2007.
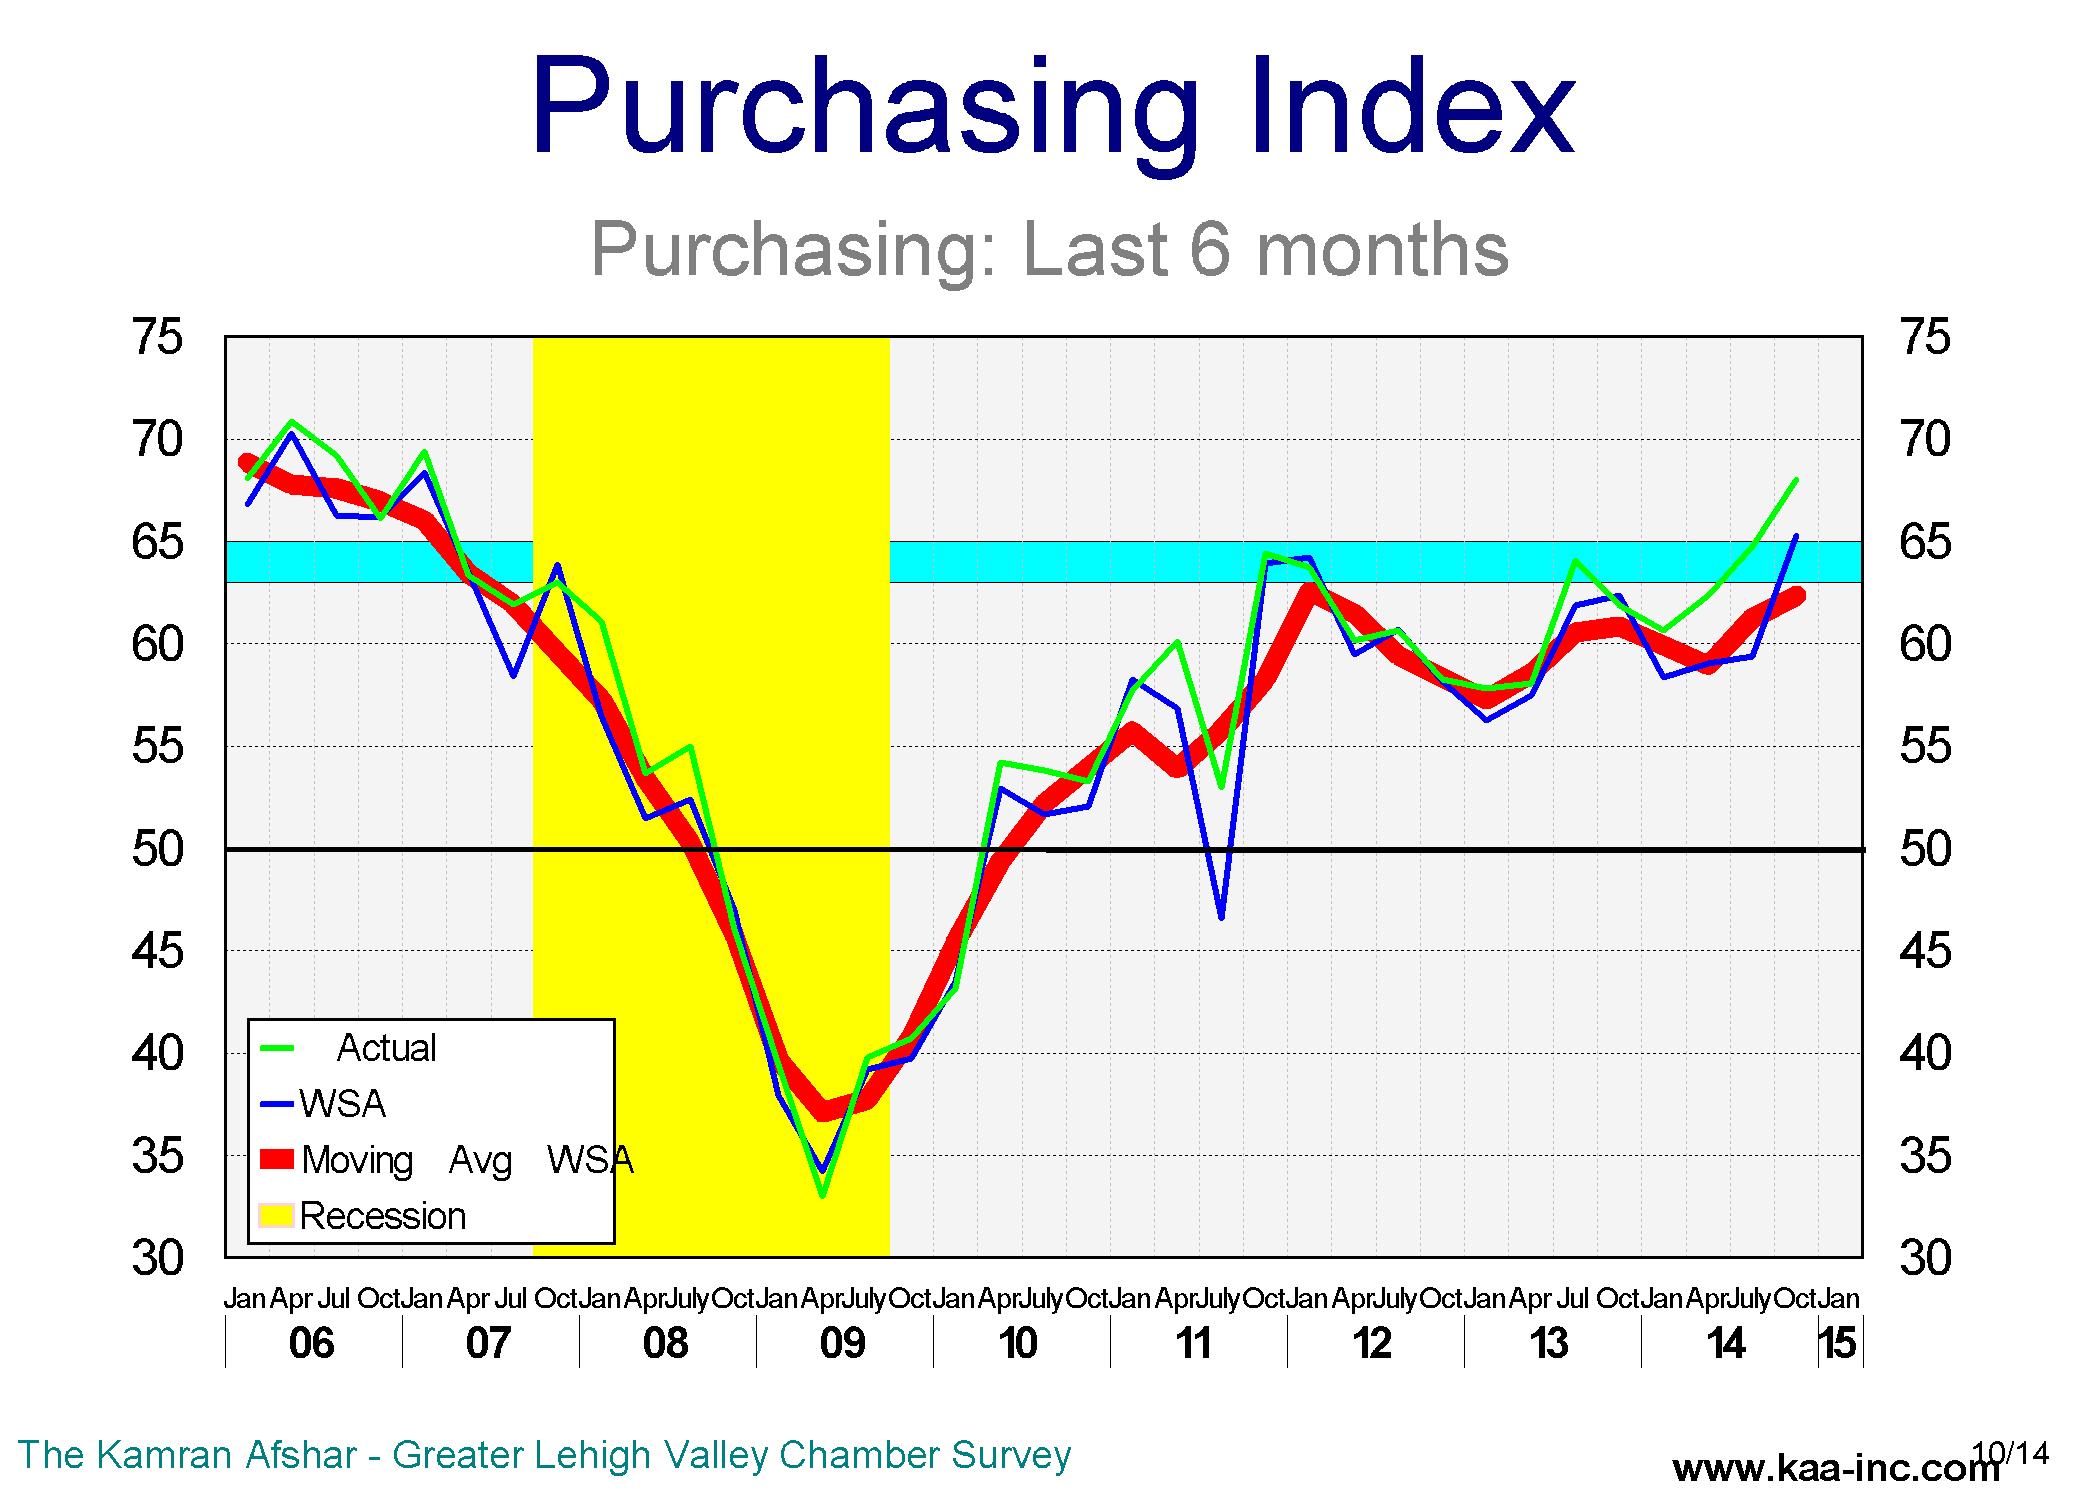
The average business participating in the survey increased their expenditures by 3.5% in the last 6 months. The trend for this indicator has been rising since 2013.
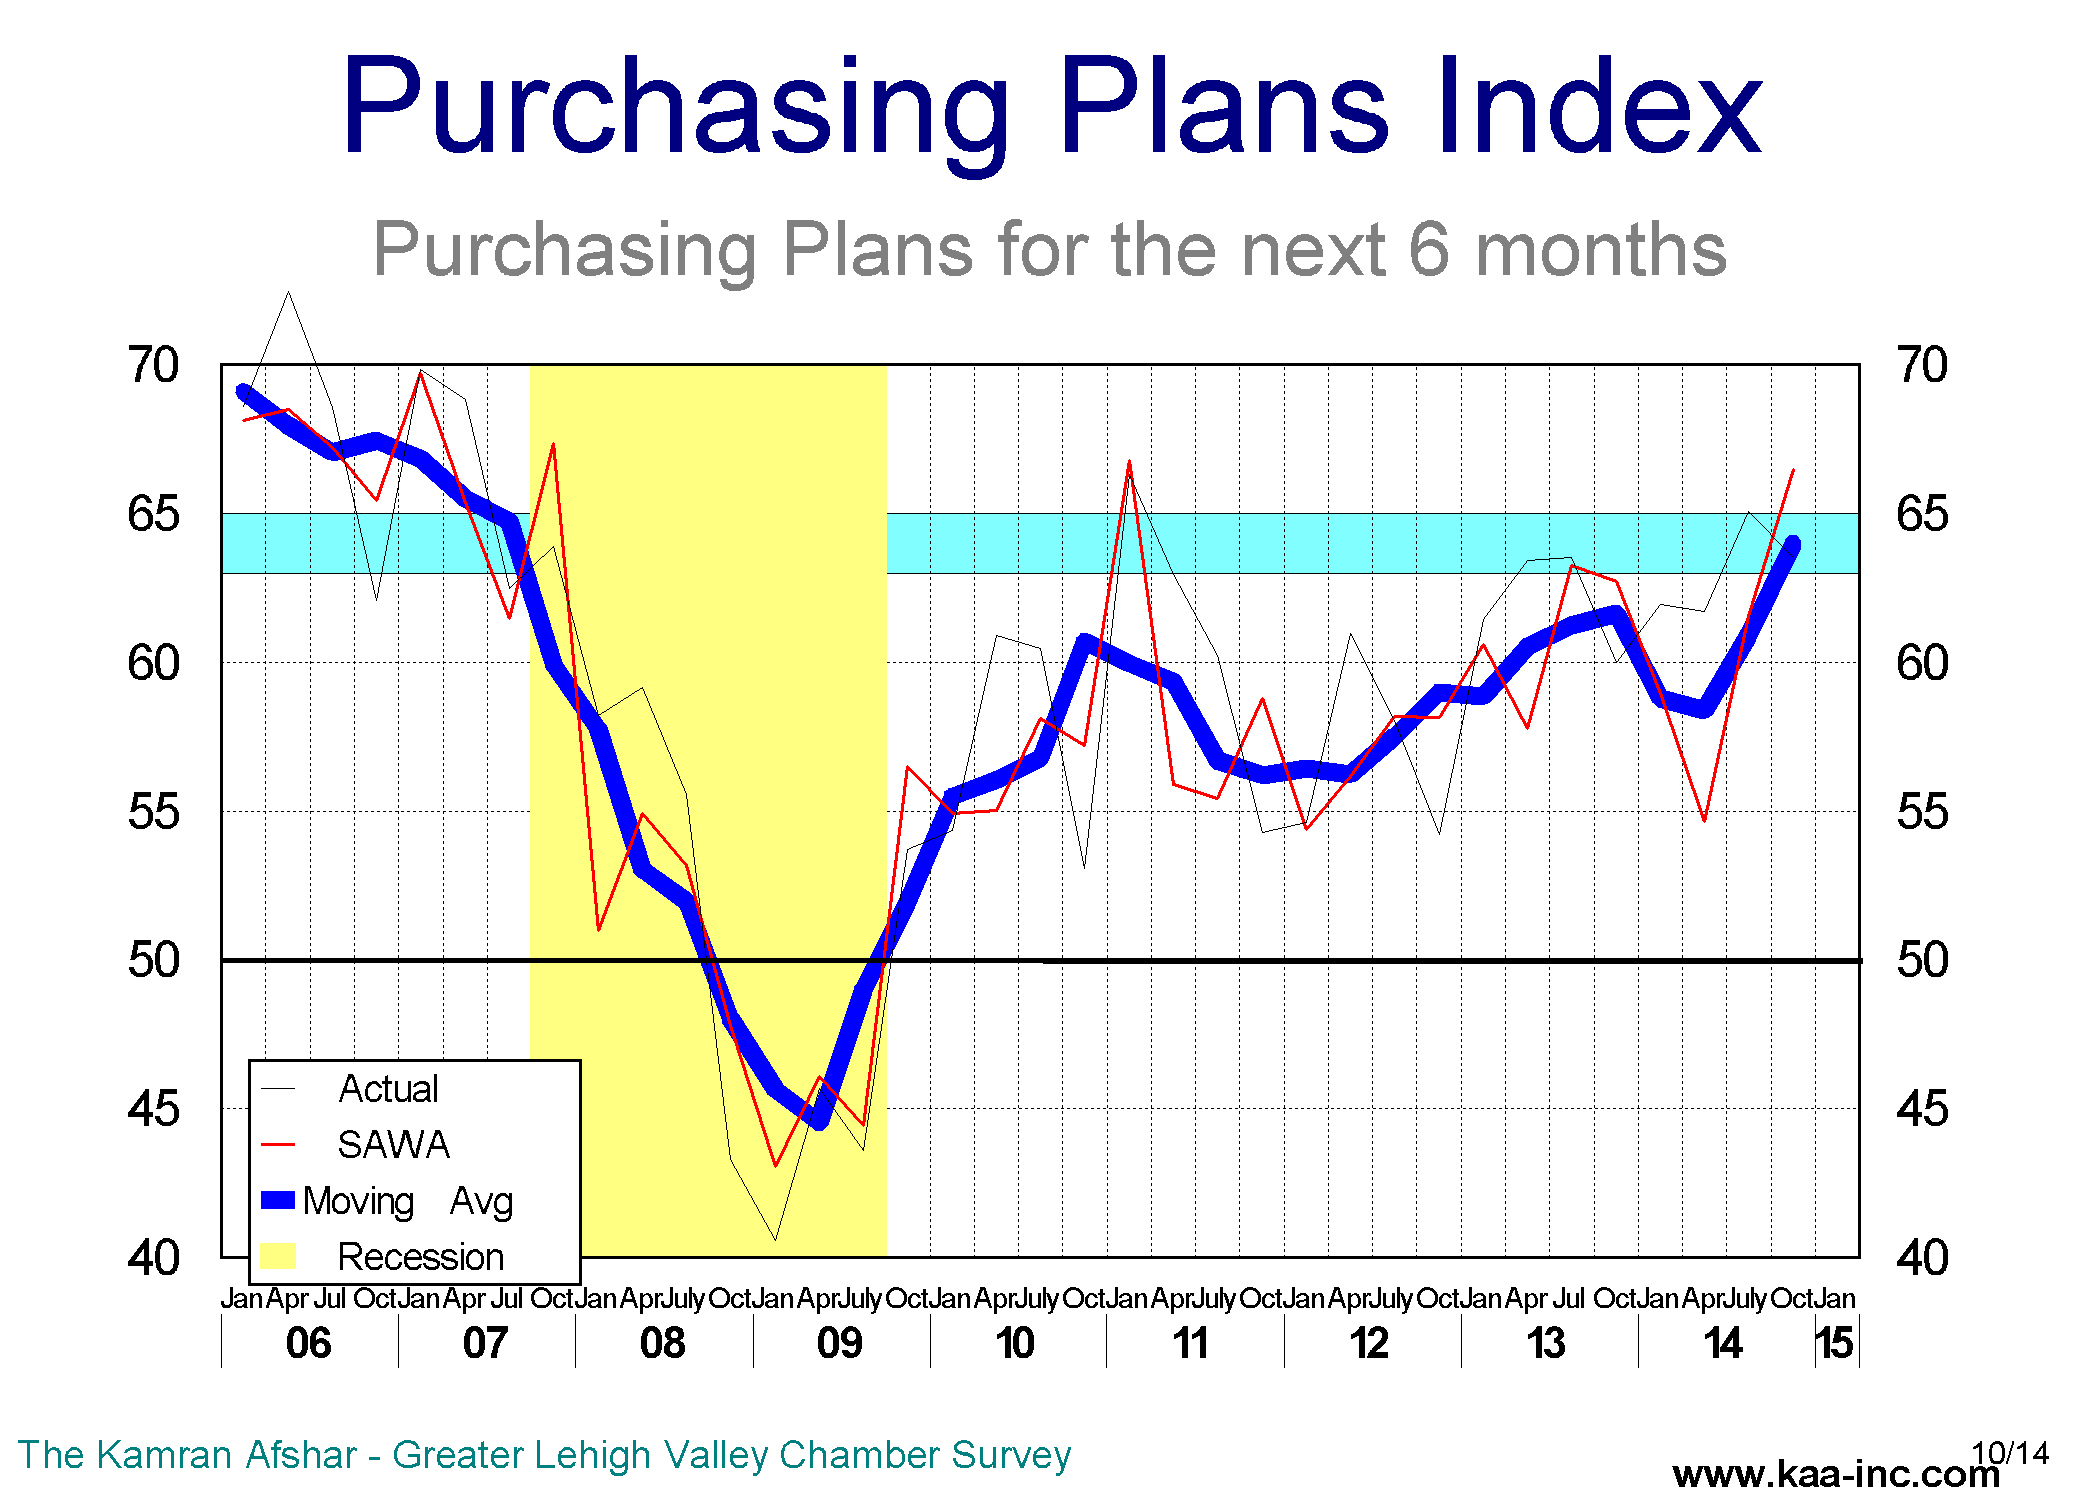
The index of expenditure plans for the next 6 months also rose by a significant 8.1% in October. An average company participating in our October 2014 survey reported 2.8% increase in their expenditures plans. The trend for this index has also been on the rise over the past 2 years.
The index of actual hiring during the last 6 months rose by 4.9% over its July level. This is also a significant increase, although it is rising only half as fast as the purchasing indicators growth. Local businesses have also raised their hiring levels from around 0.4 employees for the last couple of years to 0.9 employees as of October 2014.

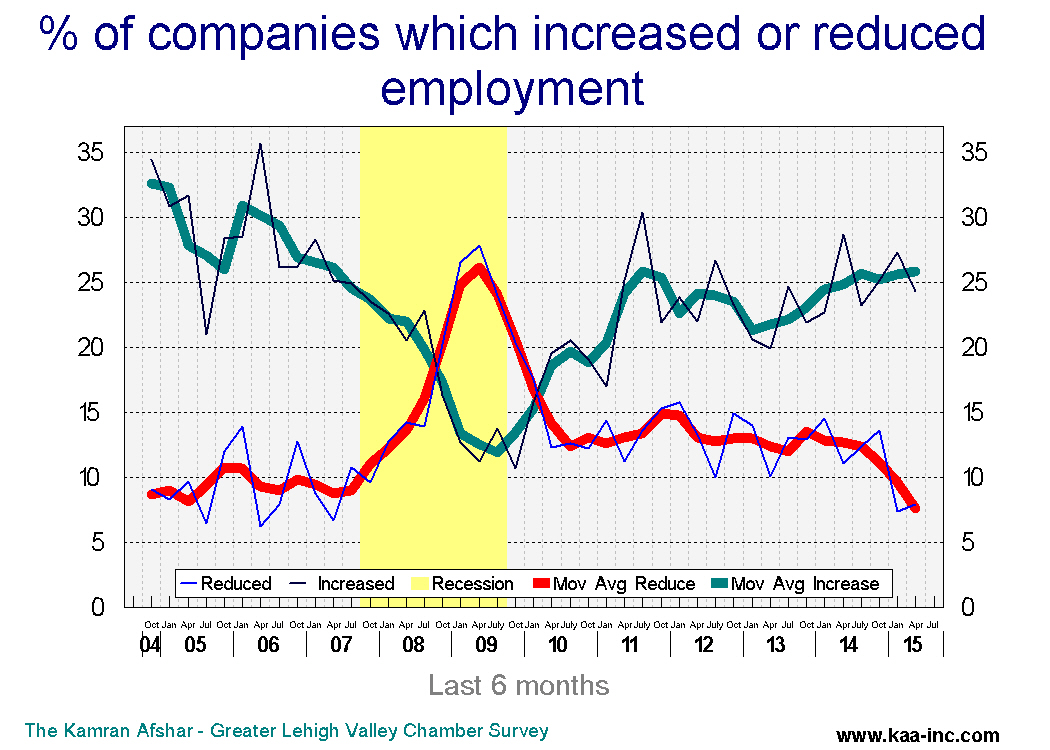
The percentage of the companies which increased their employment has been exceeding those who reduced theirs since April 2010. And in general, the percent of businesses increasing employment has risen more than those decreasing since the end of the recession.
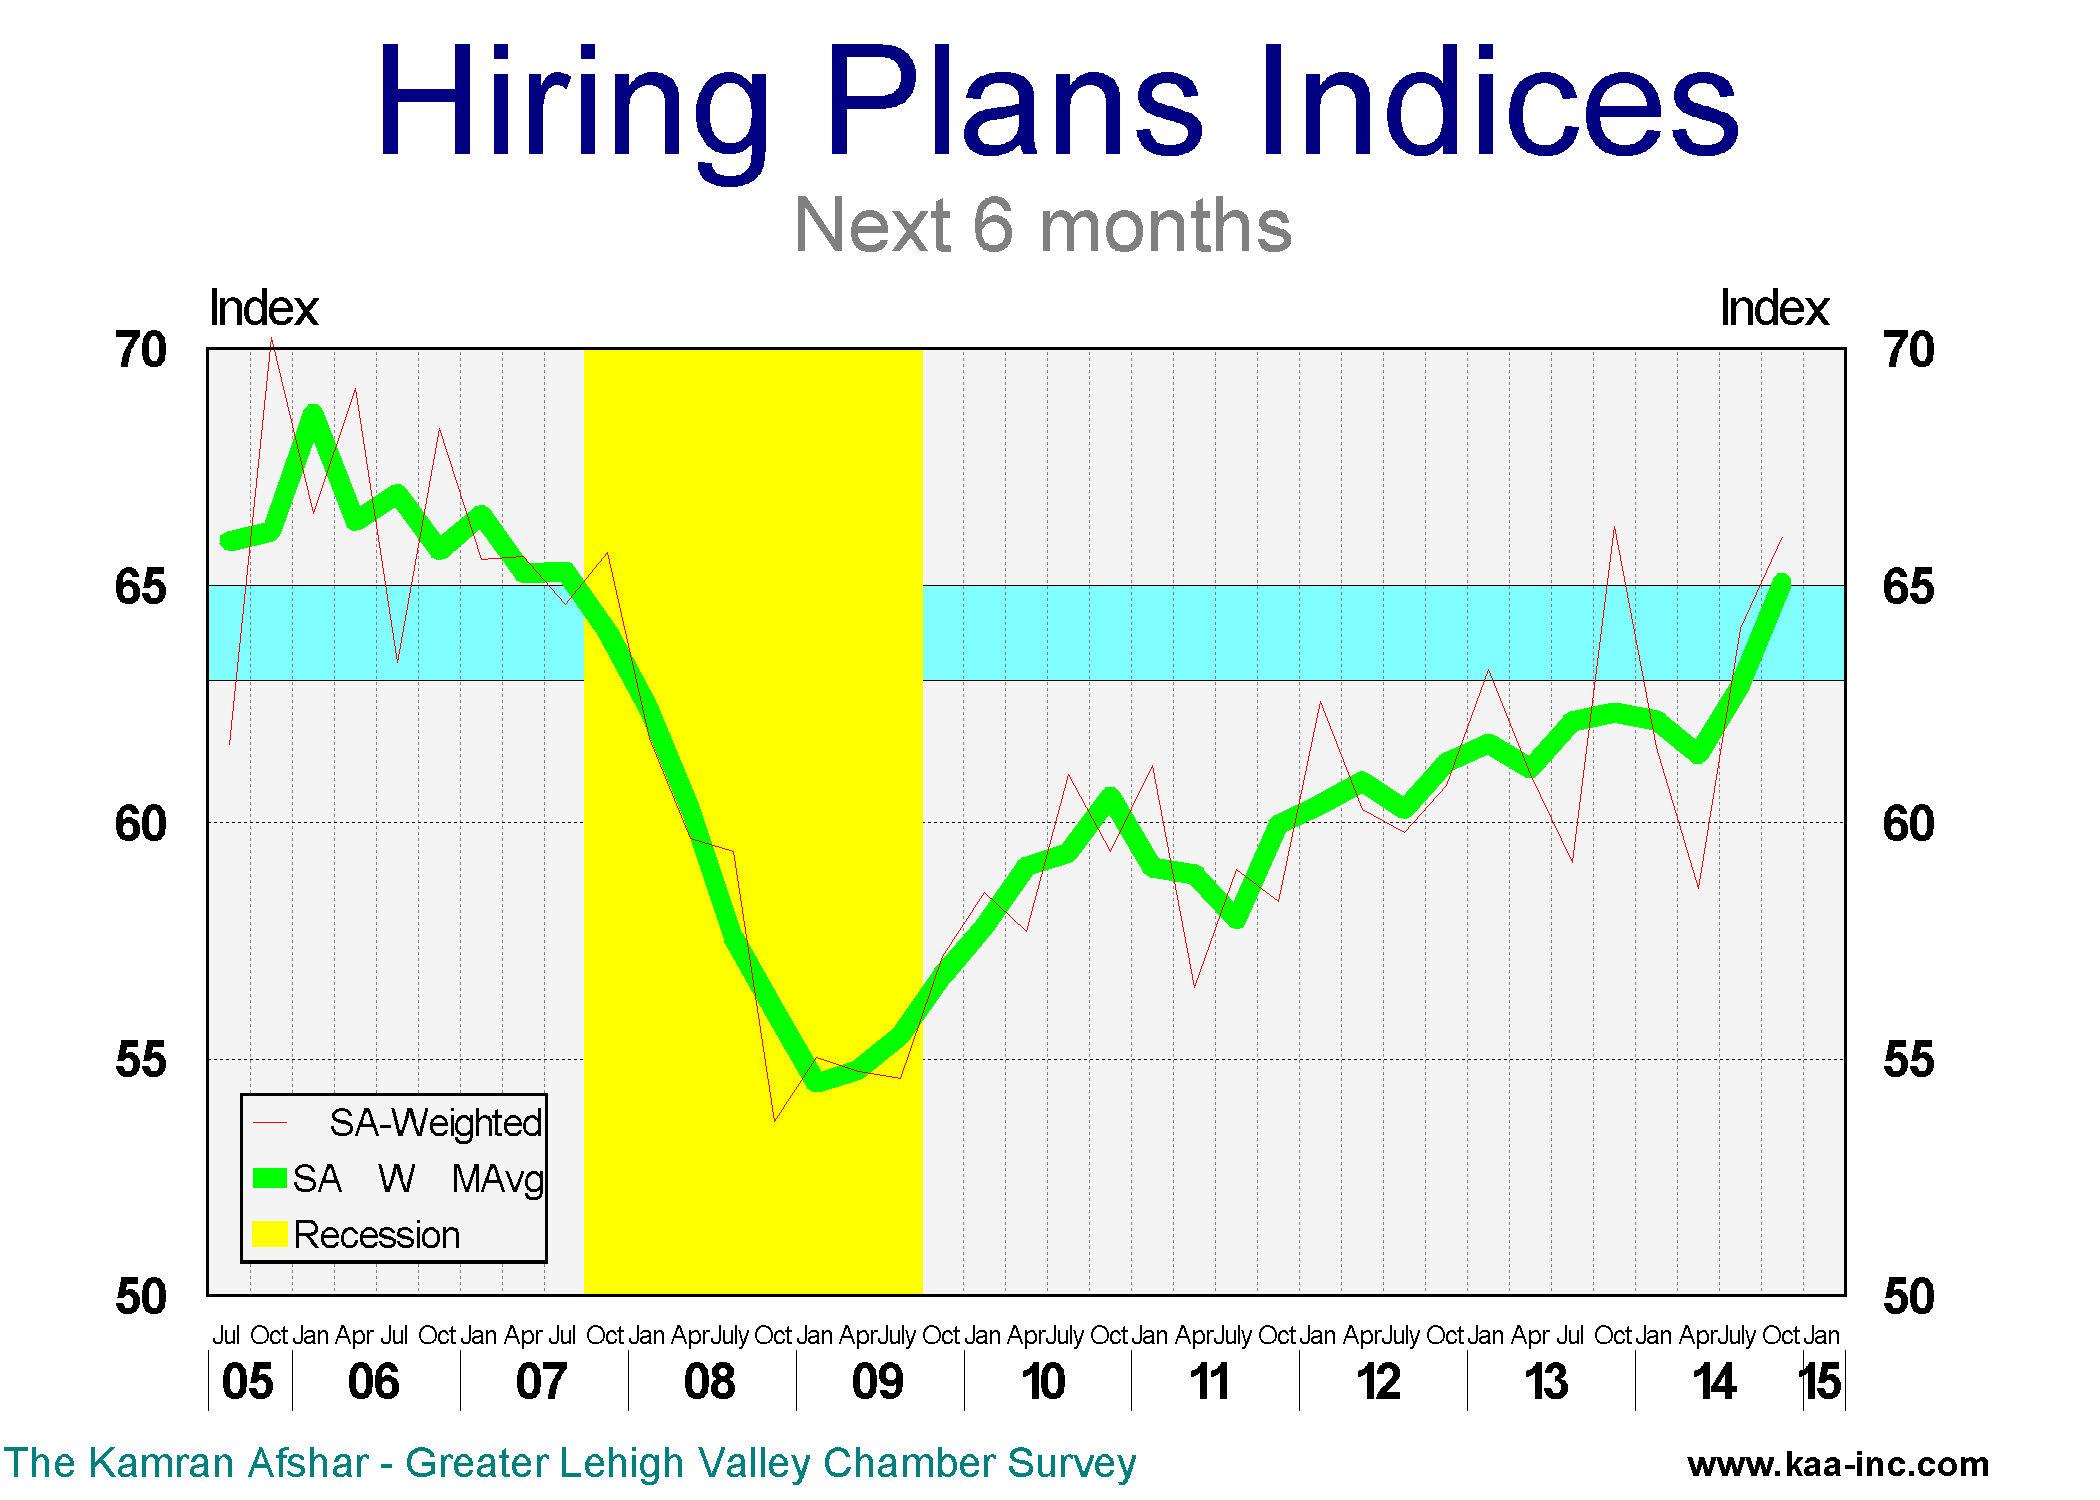
The index of planned hiring for the next 6 months rose to 66.0 in October, this was only a 3.0% growth for the index. However, it pushed this index into the expansion zone. Historically, when this index was above 65, local employment expanded at a healthy clip.
The average business participating in the survey is planning to hire one more employee in the next 6 months. We have not seen sustained plans to hire one or more employees since before the Great Recession. This is a significant increase and promises higher employment levels for the balance of 2014 and in 2015.
The percentage of companies which are planning to increase their employment in the next 6 months was 30.9% in October, this compares with 6.1% who are planning to reduce employment at their site. This is also a very positive indicator for future employment.
Businesses participating in our October survey experienced an increase in revenues in the last 6 months and expect their revenues to increase further more in the next 6 months.
Based on the data over the last 12 months we expect the Valley’s economy to show better than moderate growth over the next 6 months. Companies with 21 to 50 employees will lead the growth, expanding at a higher rate than others. And employment is expected to show a higher growth rate over the next 6 months.
Local businesses are planning to hire a lot more people in the next 6 months
The Kamran Afshar-Greater Lehigh Valley Chamber of Commerce survey of Lehigh Valley businesses is regularly conducted on a quarterly basis and about one thousand observations are collected per year. The Employment and Purchasing Index for the Lehigh Valley highlights the results of these surveys.
In July 2014 we conducted our 59th survey of this series which recorded continued cautious optimism in the local economy.
Who do we survey? We survey businesses large and small and in a variety of different lines of business; around a third of our respondents are businesses with less than 6 employees. Half of the respondents have between 6 and 50 employees and a quarter of them have more than 50 employees.
Business sentiment, as measured by the overall index rose to 59.8 in July 2014, a significant increase over April 2014, the 2nd highest level for the index since 2007.
The index shows the percent of businesses whose business sentiments are positive. Accordingly, any index above 50 means that more than half of the participants were positive about the economy. The July overall data shows around 60% of the participants were positive about the economy.
Participants’ expectations of the future rose by a strong 10.9% in July.
The largest gain in July was in the index of plans for expenditures in the next 6 months. This index soared by 12.5% over its April level. This is the third highest level for this index since the 2007.
The index of plans for future expenditures rose sharply to 61.5 in July, this was a welcome news after this index dropped significantly over the last 9 months.
The average business participating in the survey was planning to increase their expenditures by 1.7% in the next 6 months. The trend for this indicator has been rising since 2012.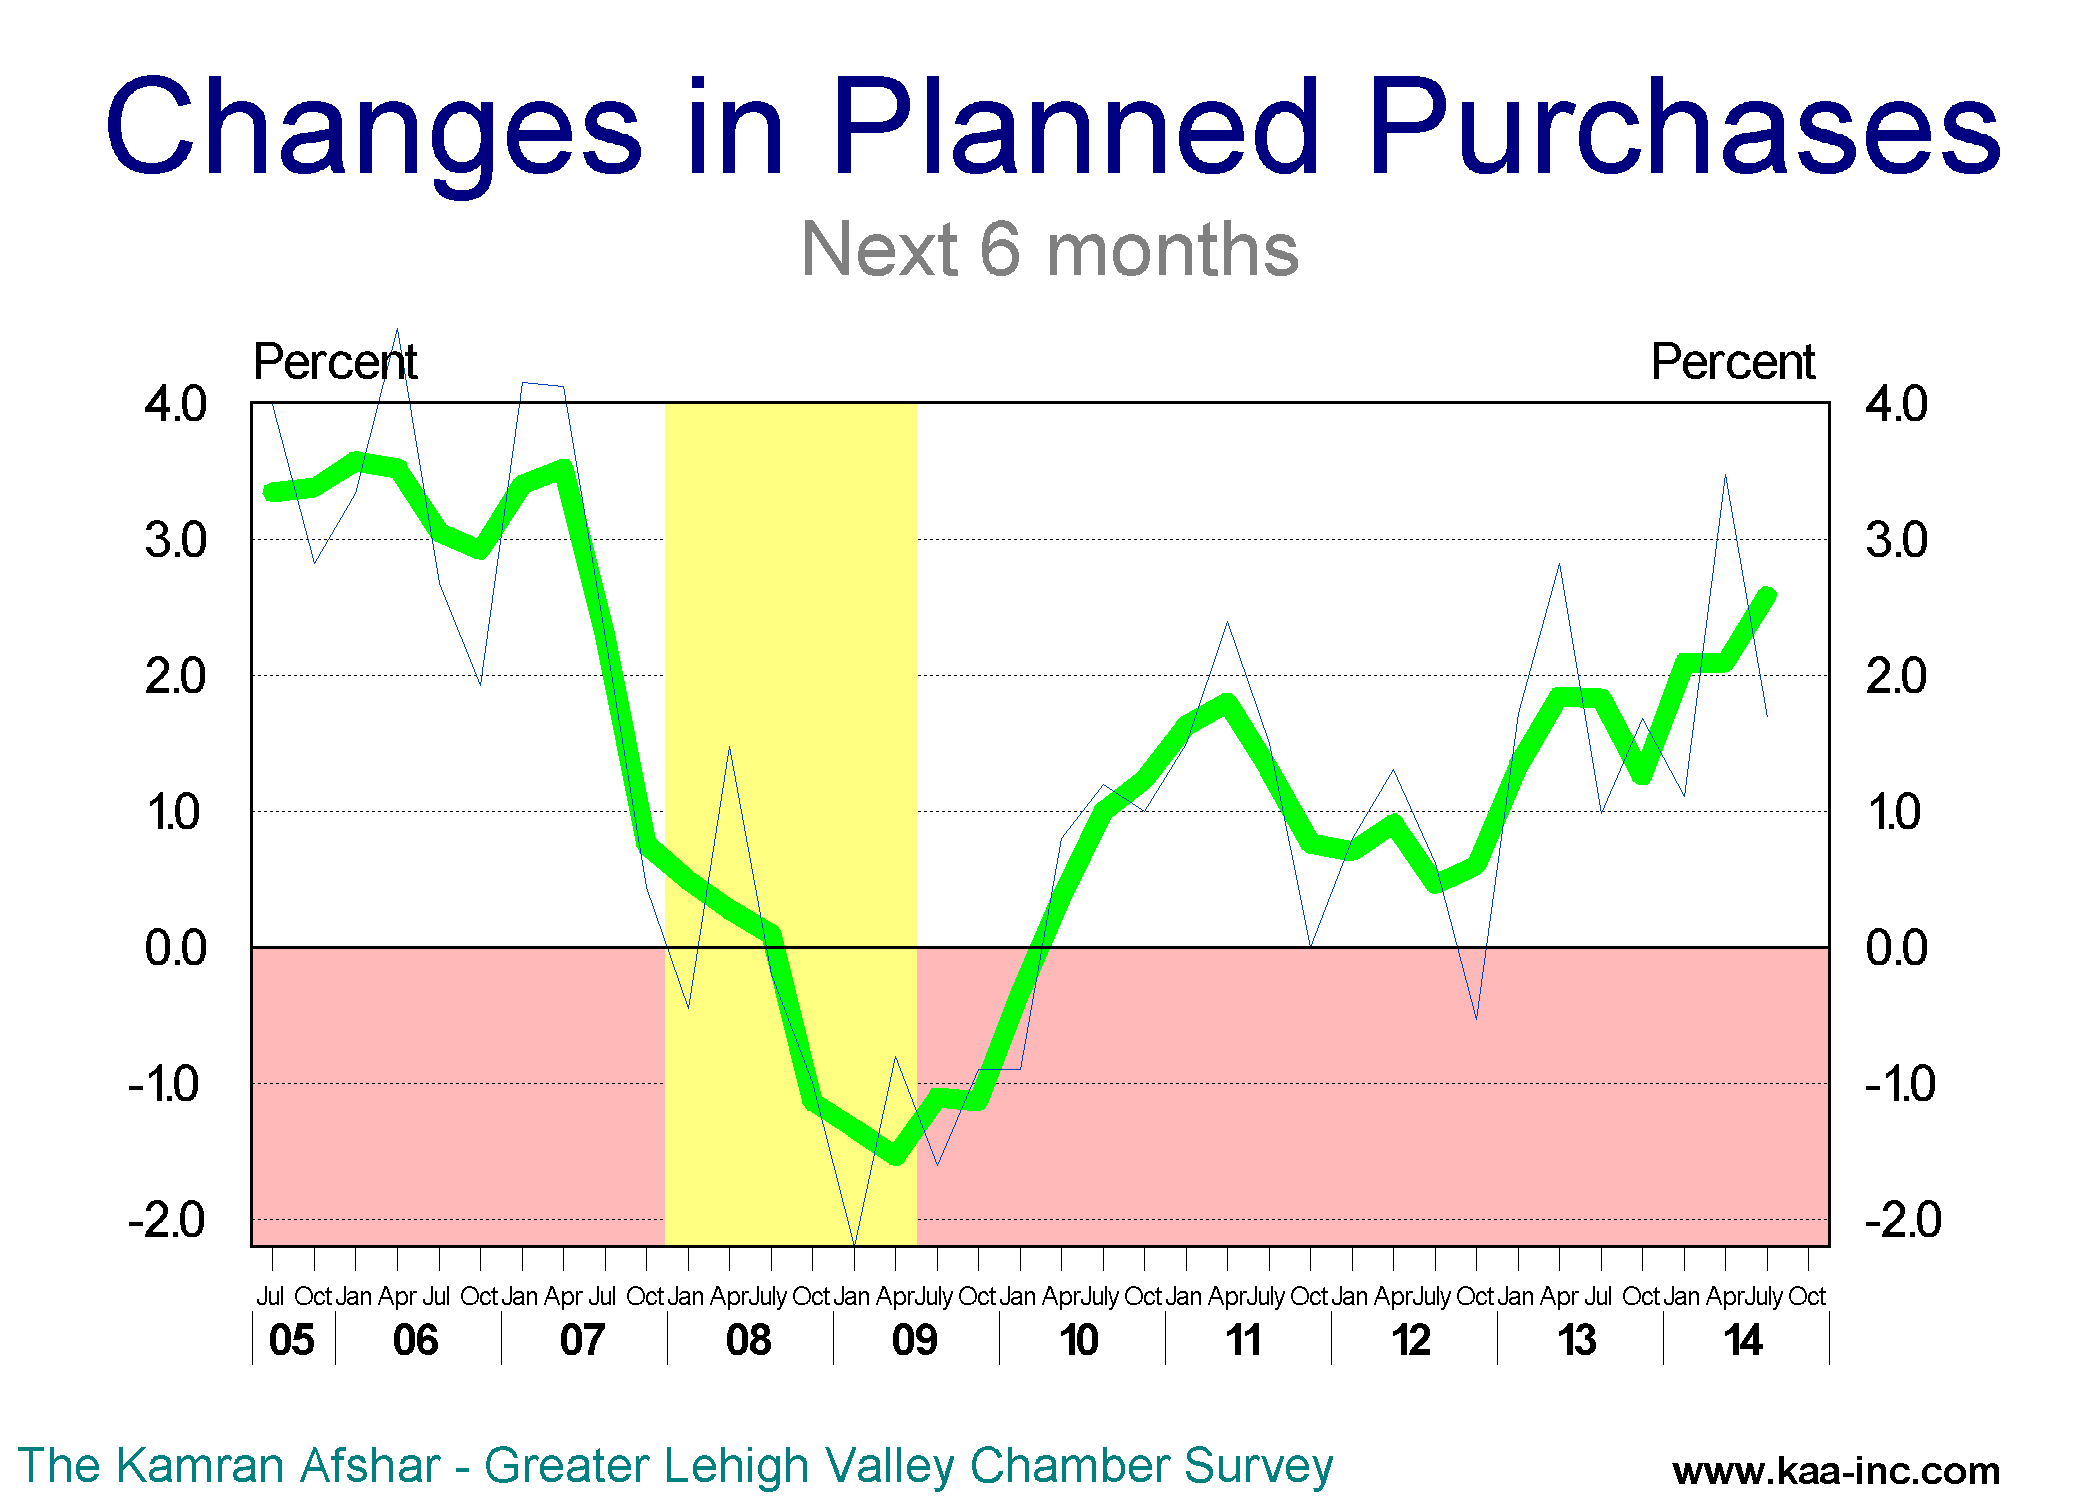
The index of actual expenditures over the last 6 months rose slightly in July. This index, after its post-recession sharp rise start dropping in 2012 and has been going sideways since 2013.
The index of actual purchases in the last 6 months represents “where the rubber meets the road.” An average company participating in our July 2014 survey reported 1.9% increase in their expenditures. The trend for this index has leveled off at around 1.7% since 2013. This number used to be around 3% in the pre-necessary years.
The index of actual hiring during the last 6 months was the only index in the group that dropped. Despite of that, its trend has been slowly rising since last July. Local businesses have also raised their hiring levels from around 0.4 employees for the last couple of years to 0.7 employees as of July 2014. This basically means that while the percentage of the companies that are hiring has slightly dropped, those who are hiring, are hiring more people.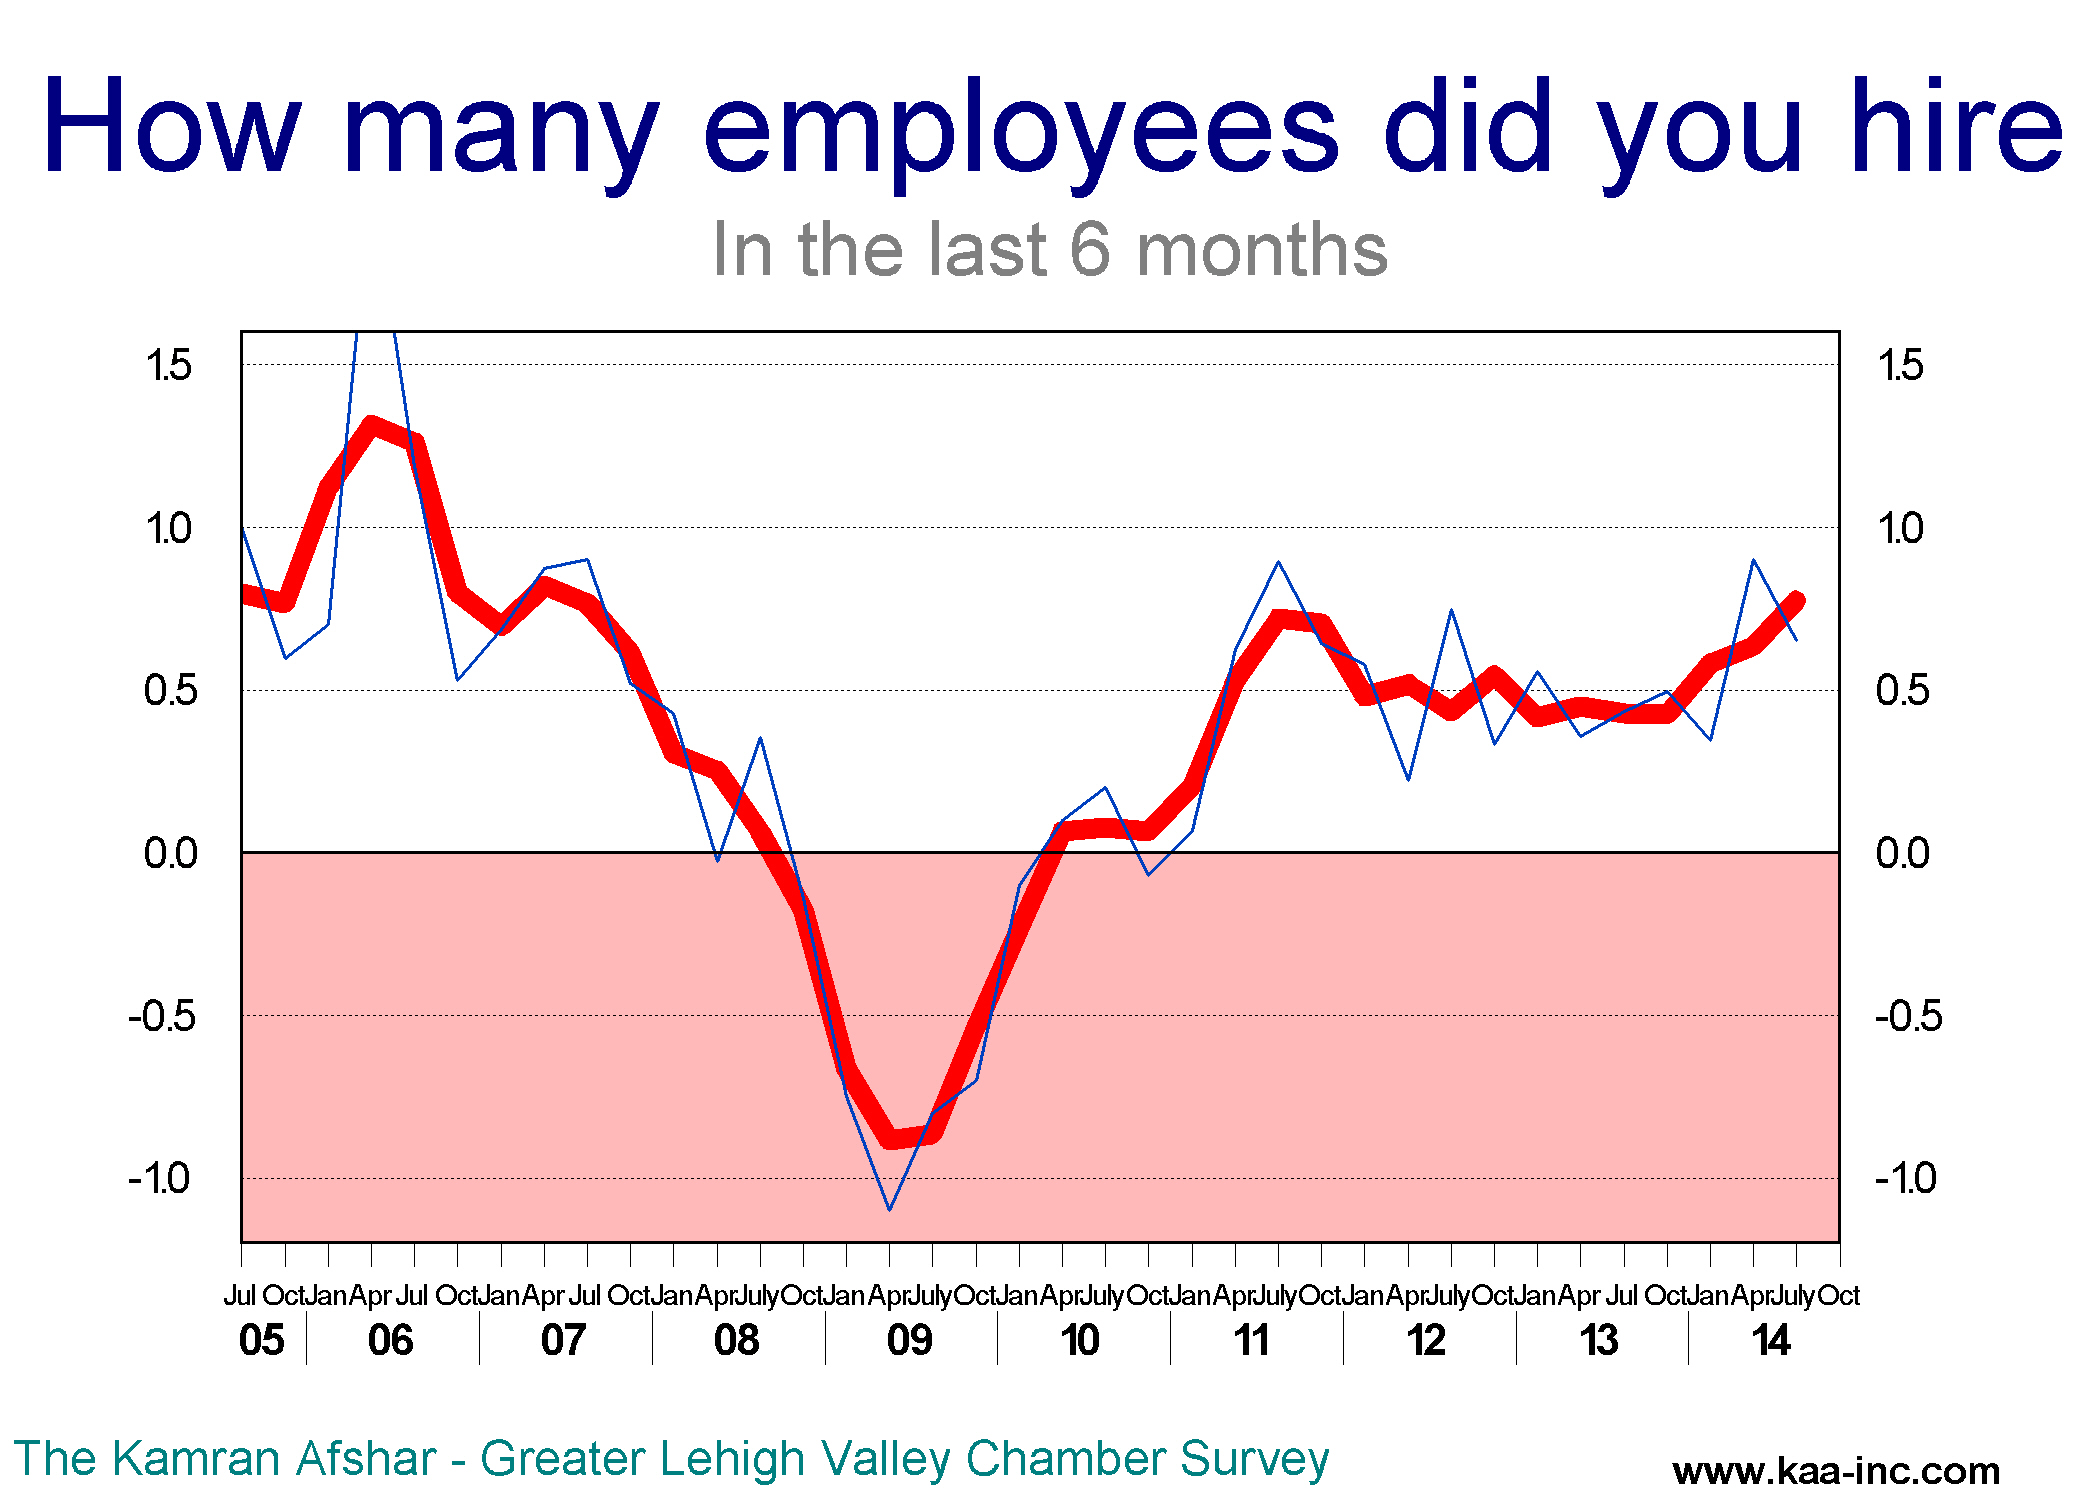
The percentage of the companies which increased their employment has been exceeding those who reduced theirs since April 2010. And in general, the percent of businesses increasing employment has risen more than those decreasing since the end of the recession.
The index of planned hiring for the next 6 months rose to 64.1 in July, this was a strong 9.4% growth for the index. This index has moved very close to the expansion zone which will happen when the index moves above 65.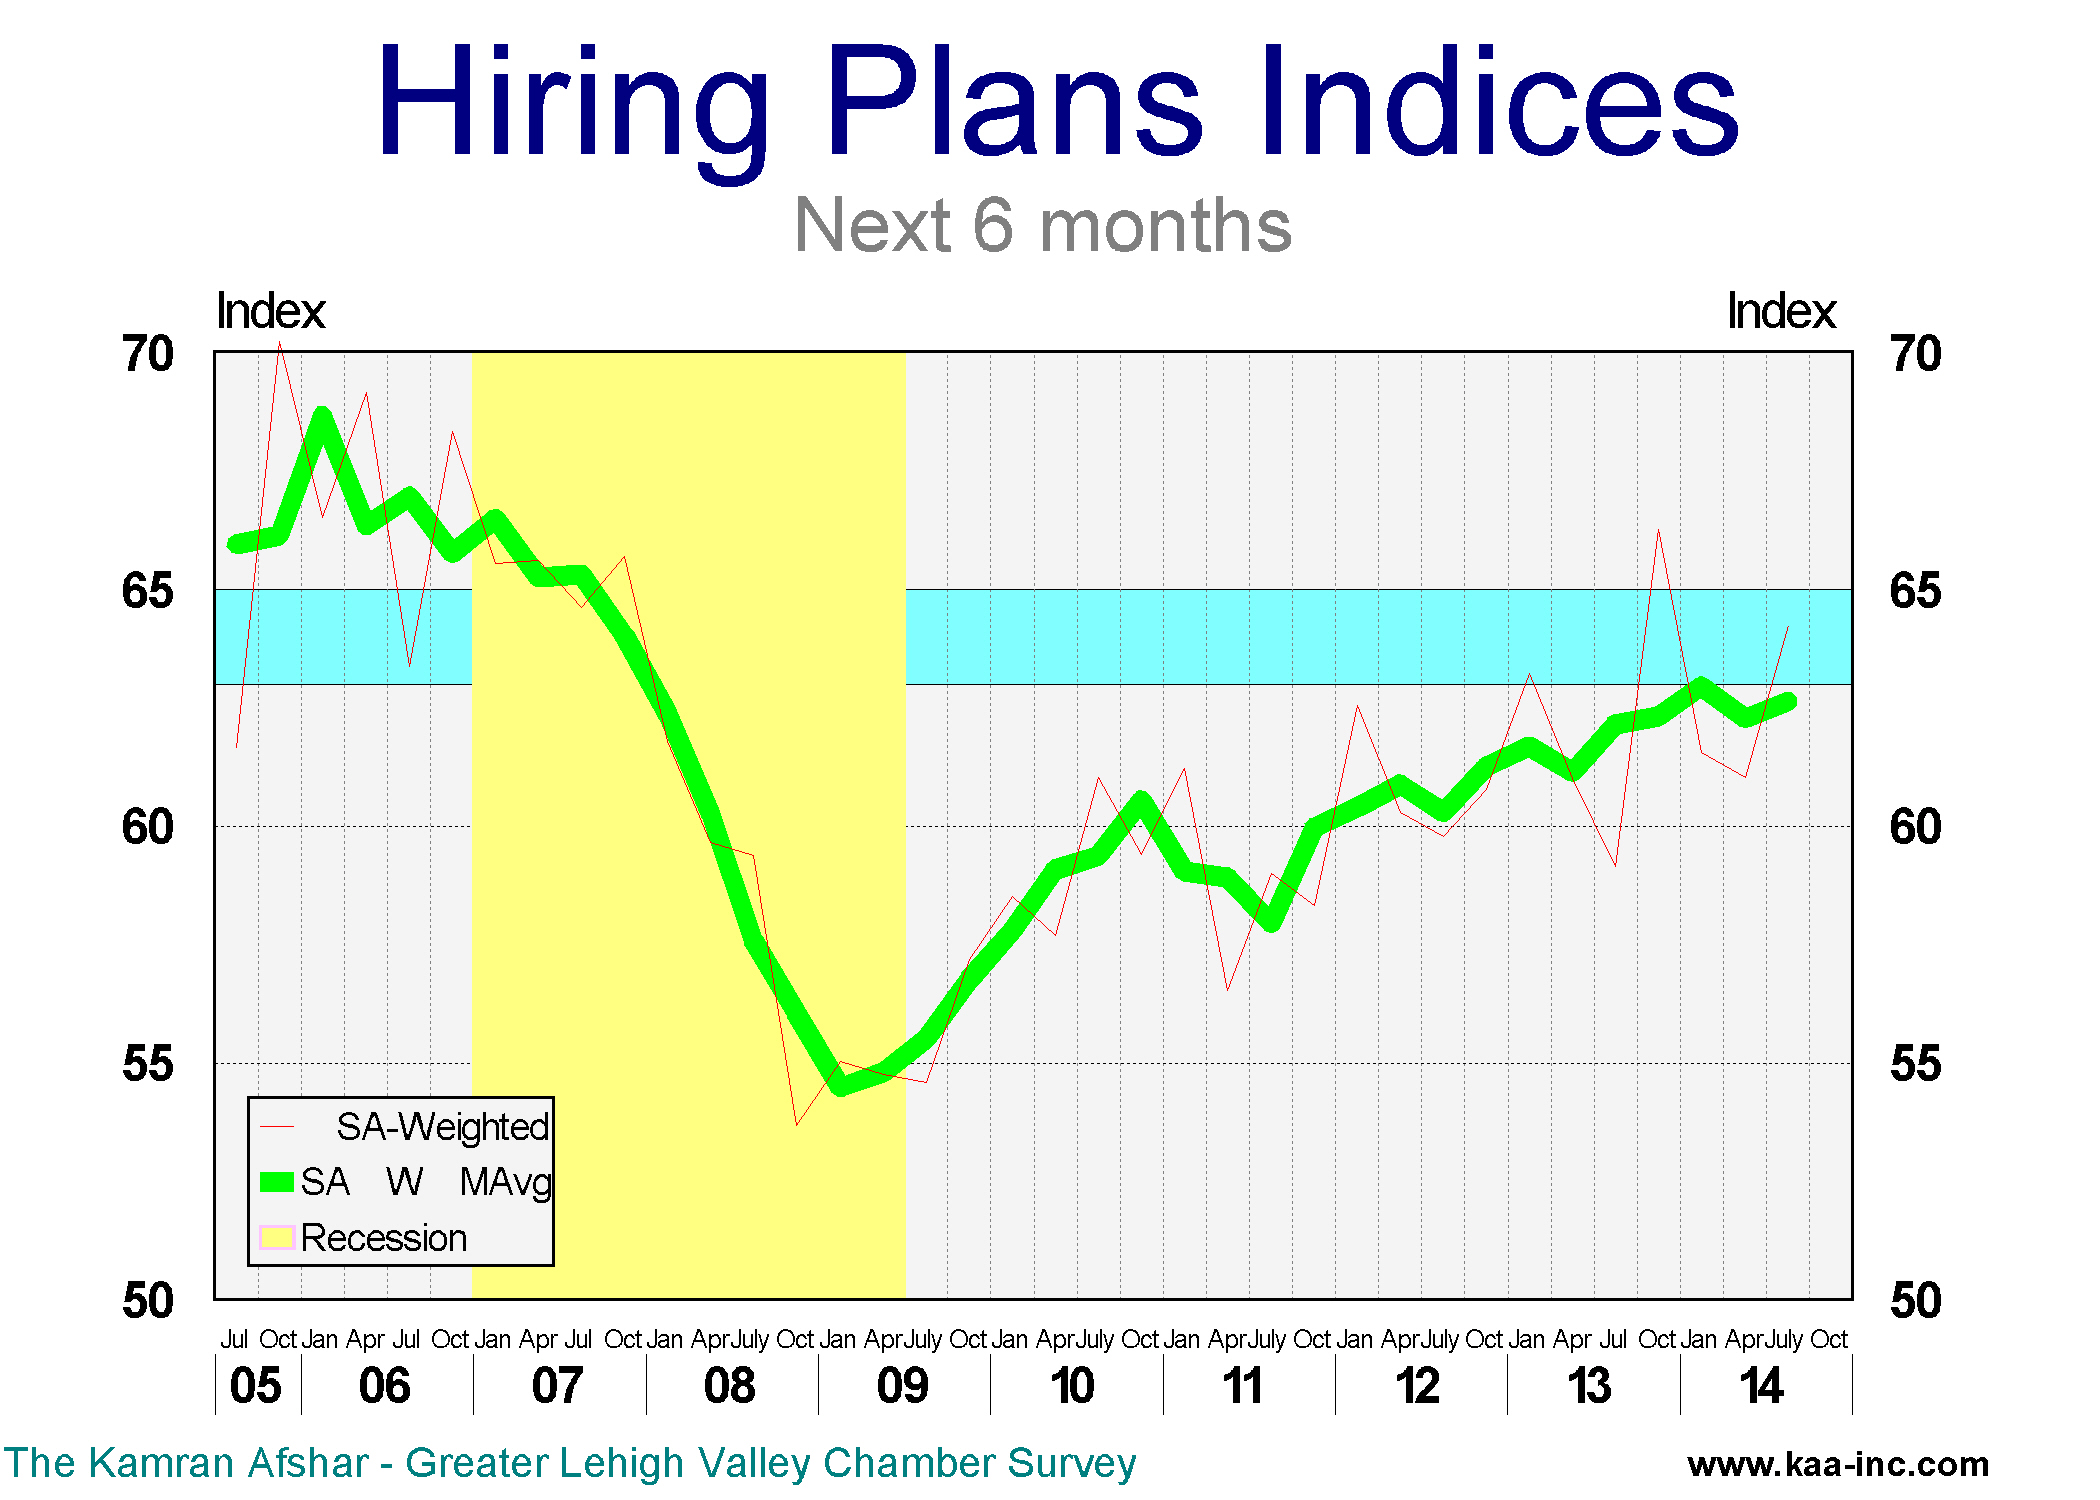
The average business participating in the survey is planning to hire 1.1 more employees in the next 6 months. We have not seen sustained plans to hire more than one employee since before the Great Recession. This is a significant increase and promises higher employment levels for the 2014 and 2015.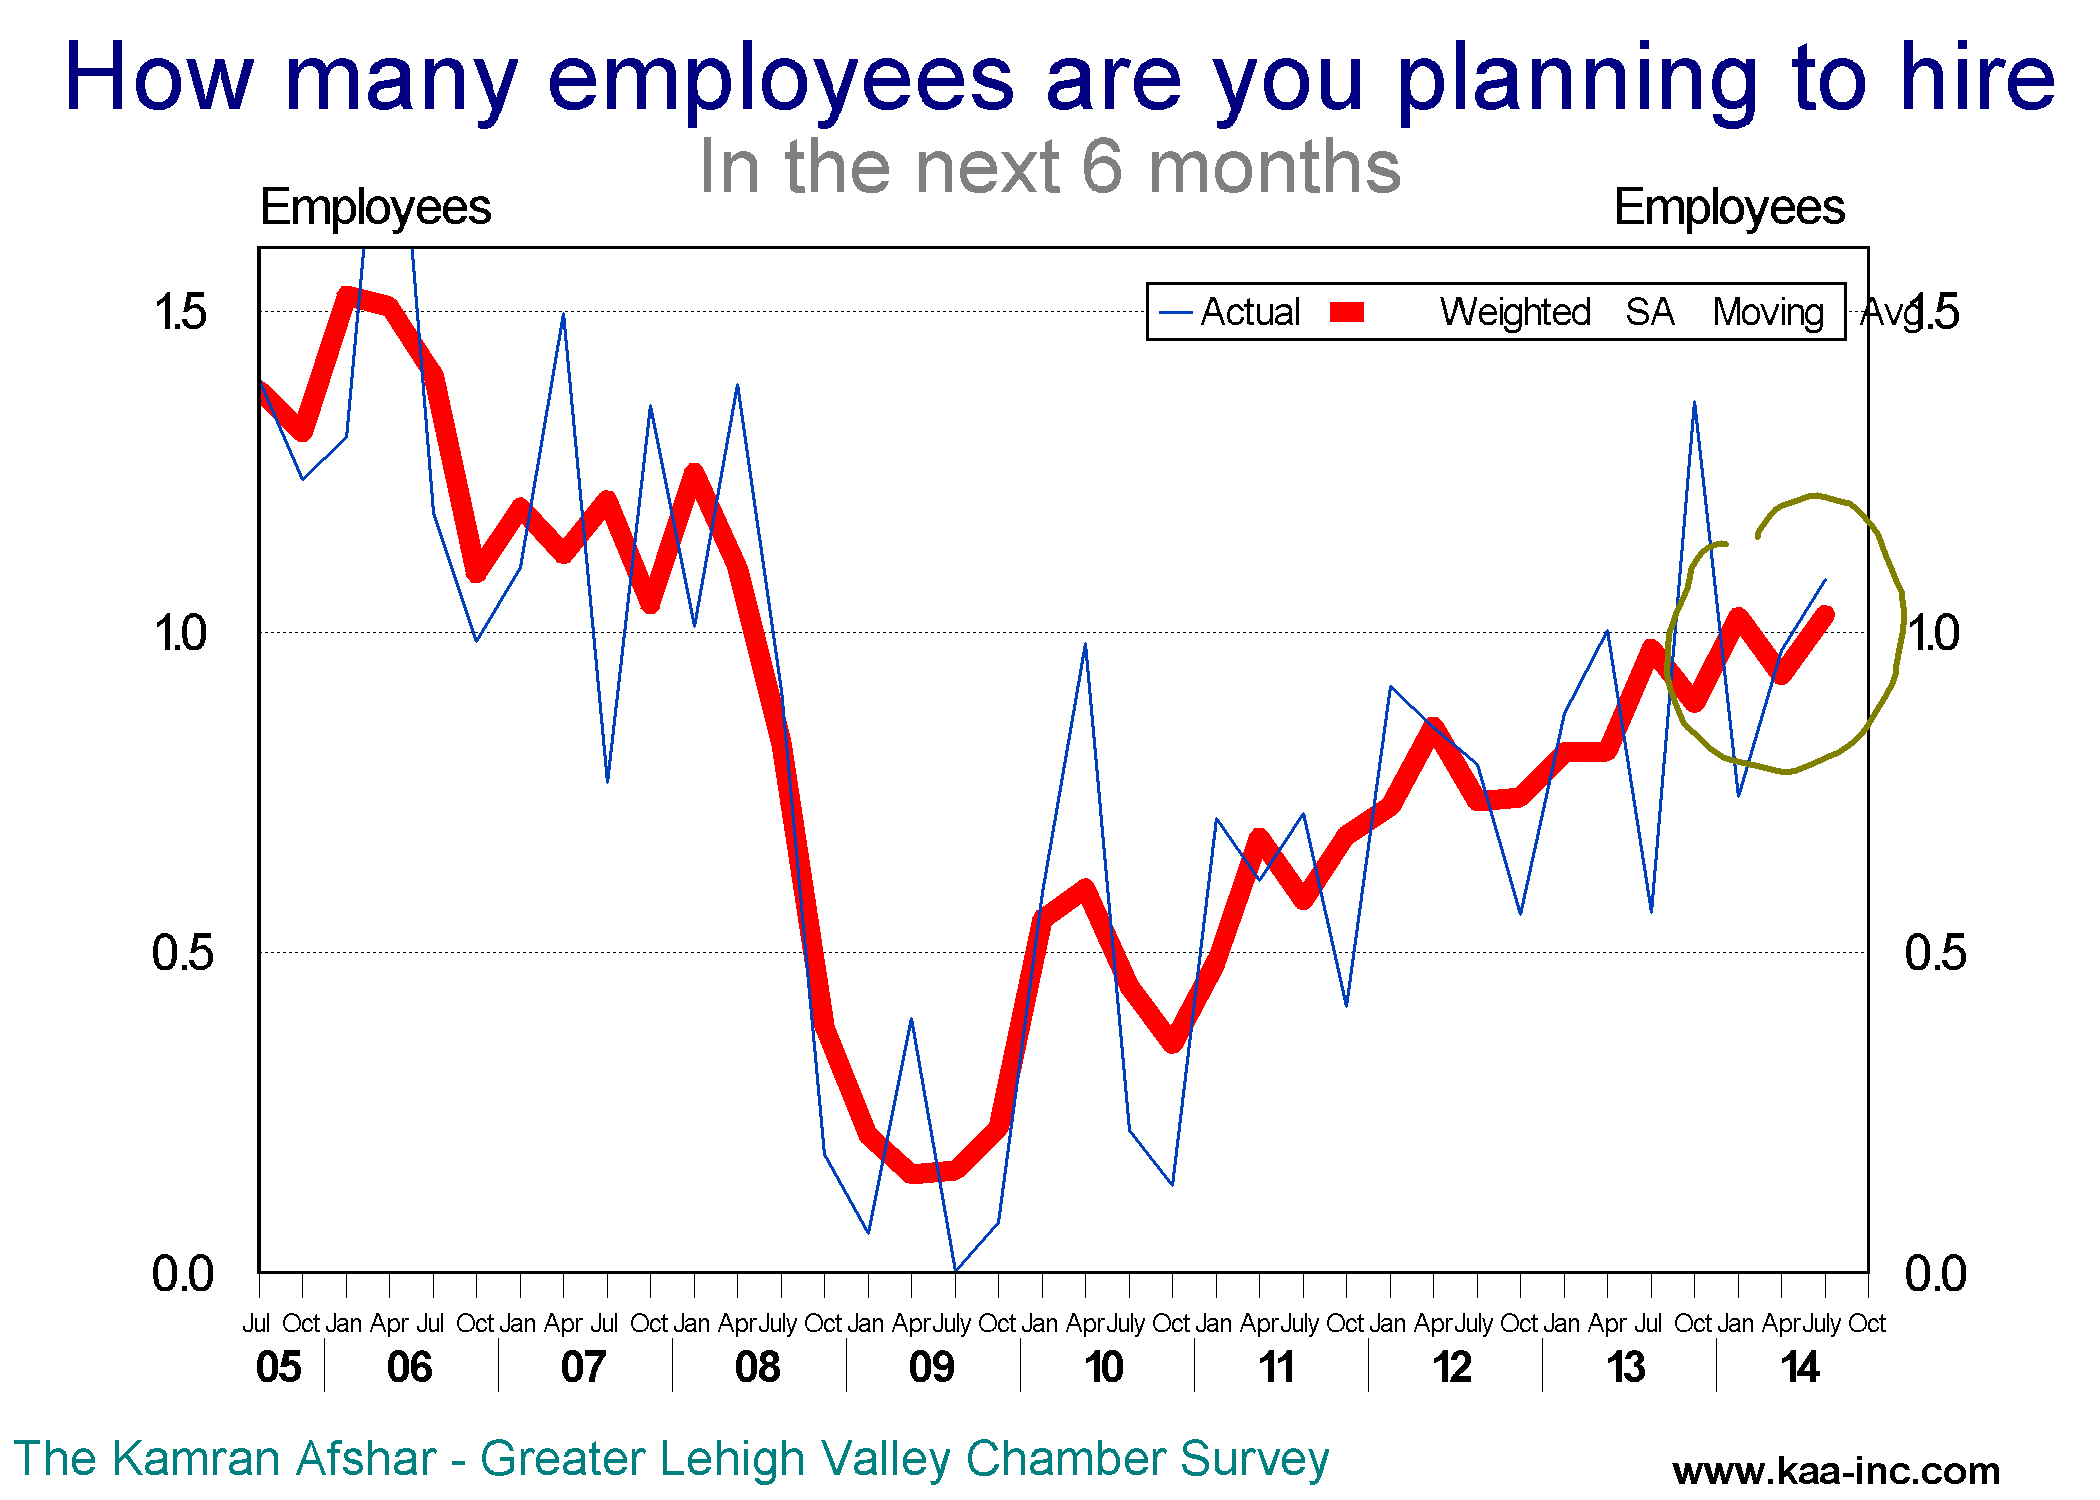
The percentage of companies which are planning to increase their employment in the next 6 months rose to 35%, compared to 7% who are planning to reduce employment at their site. This is also a very positive indicator for future employment.
Construction businesses participating in the July survey indicated that they are planning to reduce their employment in the next 6 months. This was the only category that is planning to reduce employment. Accommodation and food industries lead the rest of the local businesses in their expansion plans for the next 6 months.
The survey also shows that among different size businesses in the Valley, a larger percent of those who employ between 21 and 50 people are planning to increase their employment in the next 6 months. And as has been the case over the last years, the least optimistic group in the category are businesses with less than 6 employees.
Based on the data over the last 12 months we expect the Valley’s economy to show moderate growth over the next 6 months. Companies with 21 to 50 employees will lead the growth, expanding at a higher rate than others. And employment is expected to show a higher growth rate over the next 6 months than before.
The Kamran Afshar- Greater Lehigh Valley Chamber of Commerce survey of Lehigh Valley businesses is done on a quarterly basis and collects around a 1,000 observations per year. The Employment and Purchasing Index for the Lehigh Valley highlights the results of these surveys.
In April 2014 we conducted our 58th survey of this series, The following is a summary of our findings.
Business sentiment, as measured by the overall index dropped to 58.9 (seasonally adjusted weighted average, SAWA) in January 2014, a 4.6% drop from October 2013. However it is still 0.4% above the January 2013 level.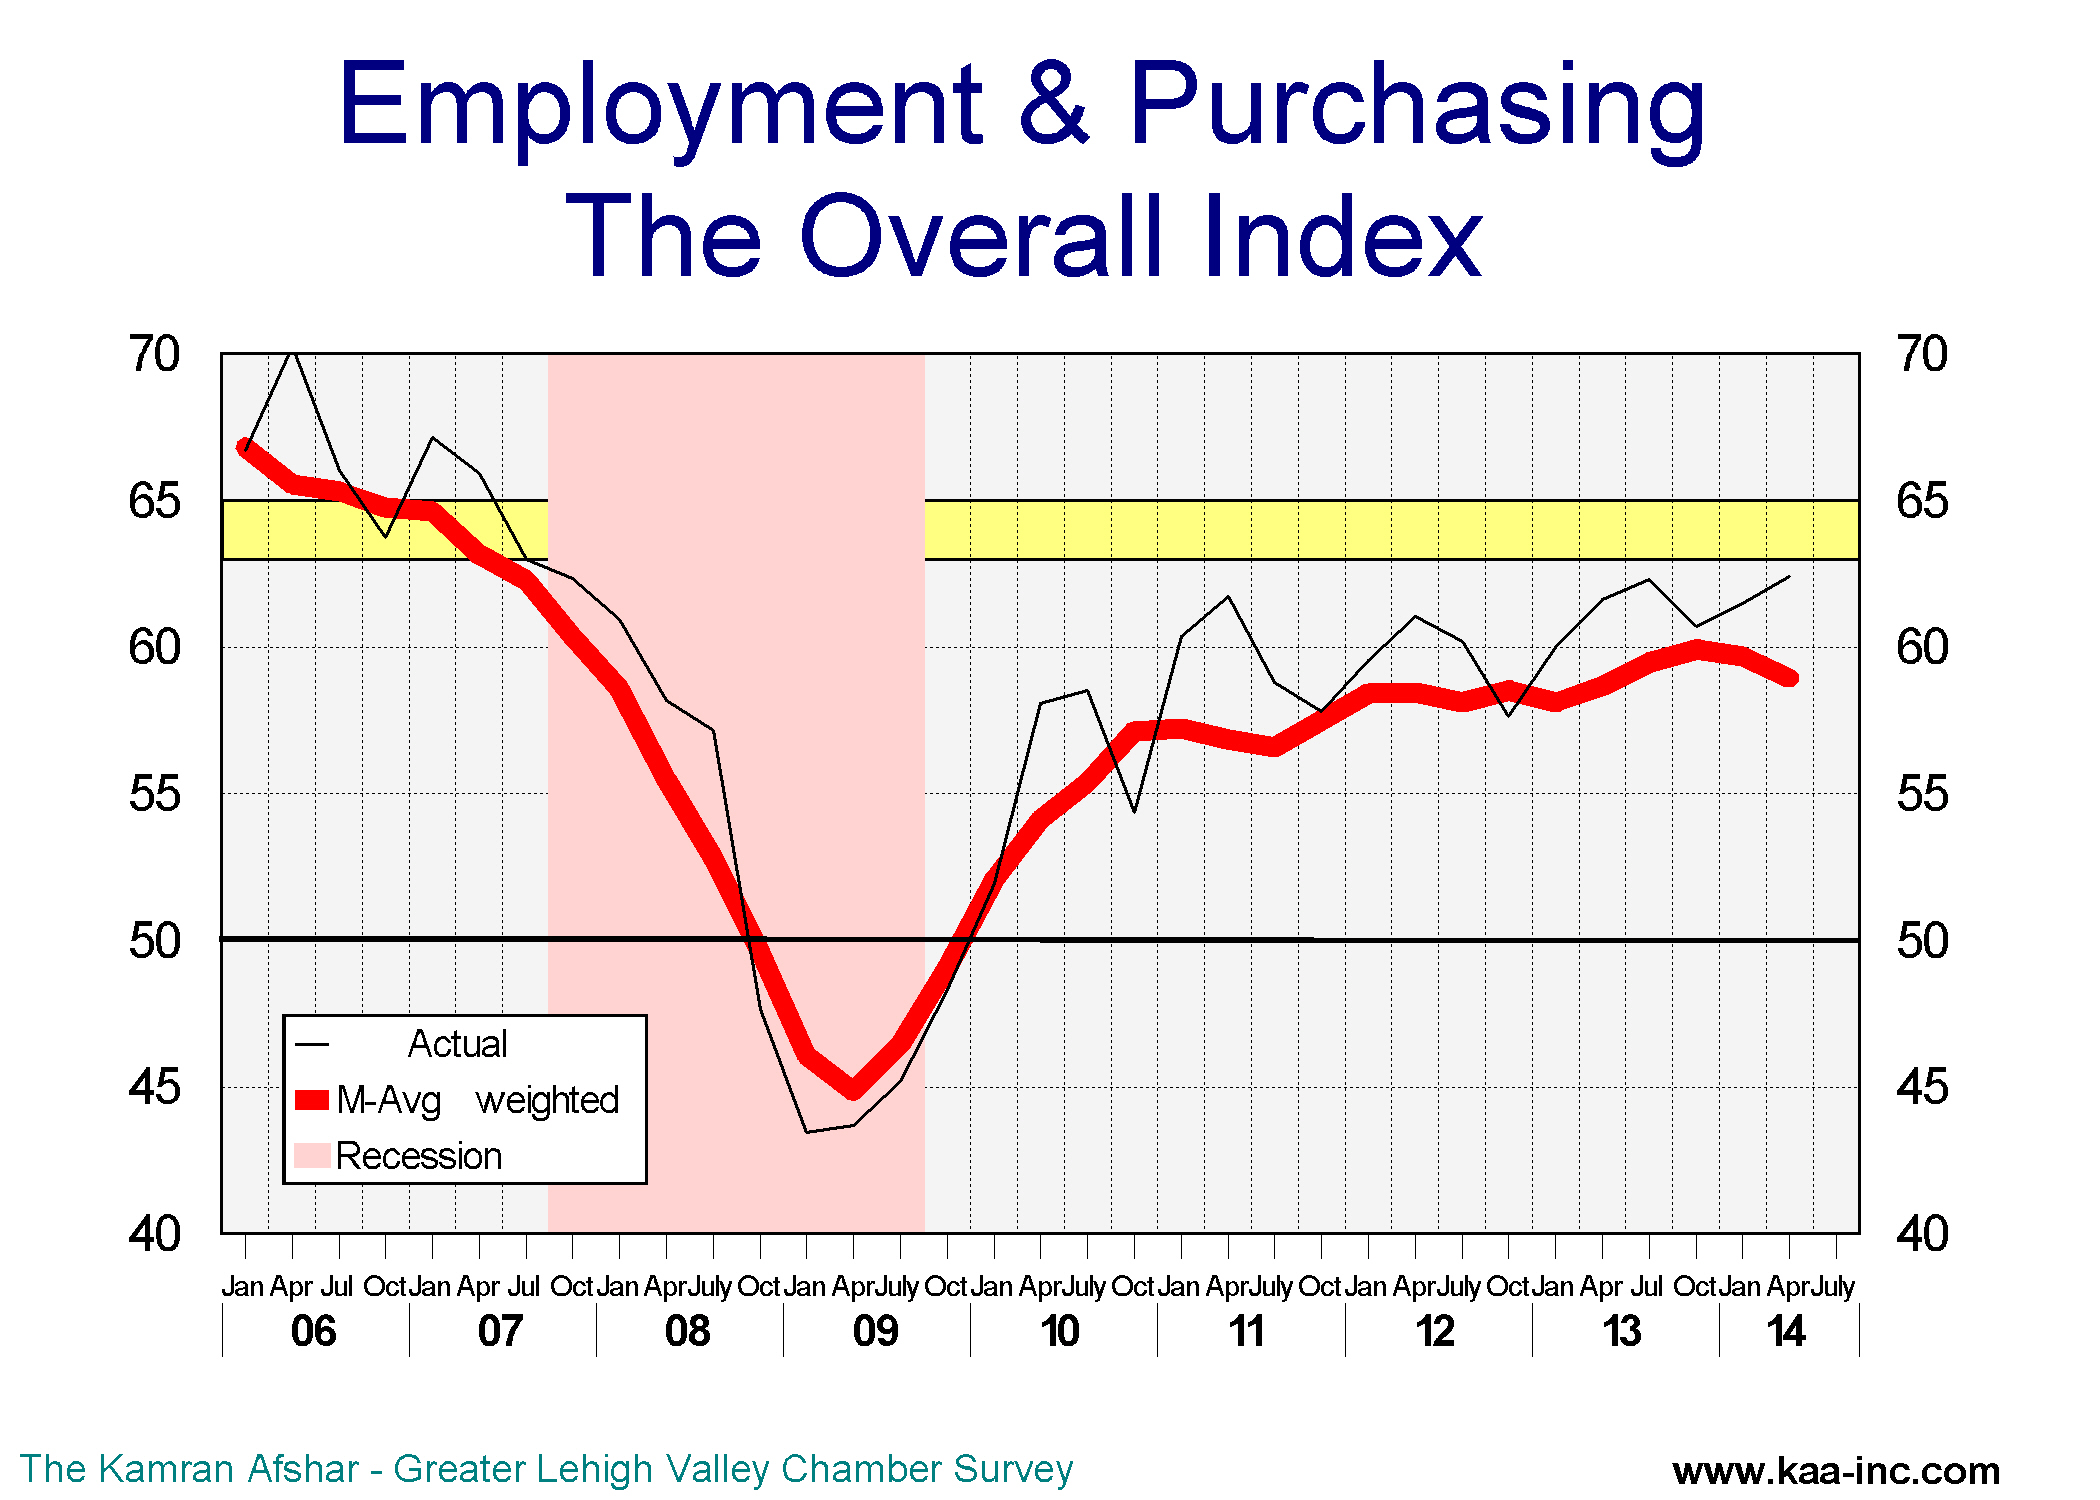
It should be noted that any index above 50 means more than half of the participants were positive about the economy.
Participants’ expectations of the future showed a slight decline while their assessment of the past recorded an equally slight increase in April. However, neither change is statistically significant. The moving average of the expectations of the future has show some decline, while the assessments of the past has remained more or less constant.
The largest gain in April was in the index of planned hiring for the next 6 months. This index was up 4.5% and 5.4% respectively as measured against January 2014 and April 2013.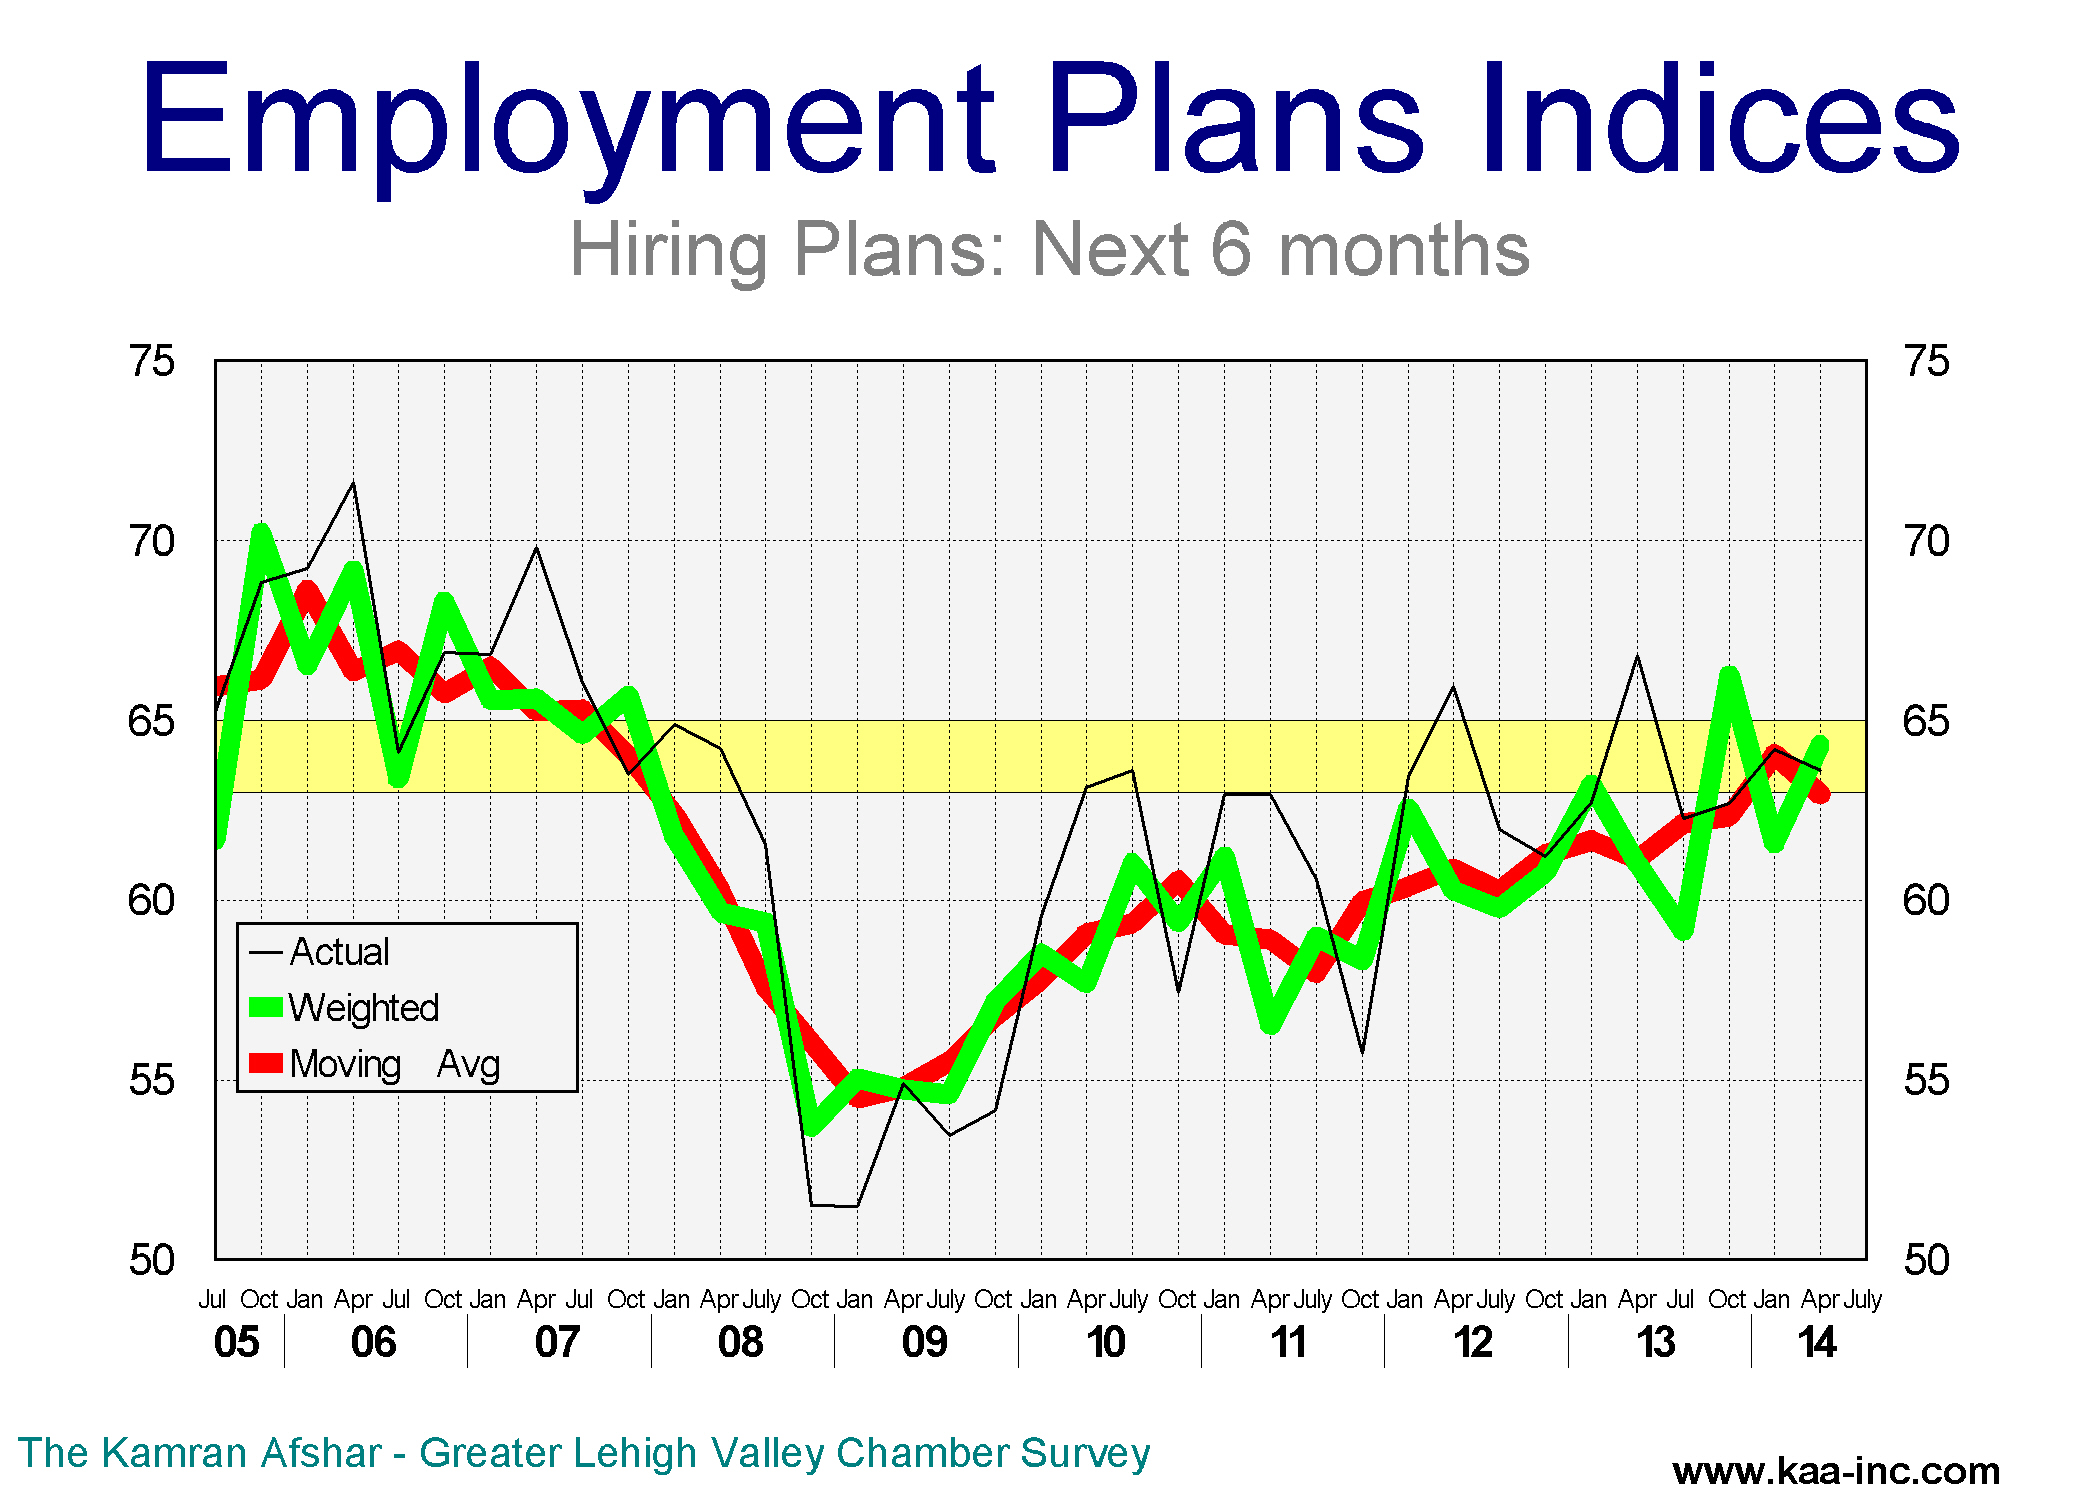
The index of planned hiring for the next 6 months rose to 64.3 in April. For the second time in the last 6 months this index has reached this level, highest since October of 2007. This is also well inside the Valley’s expansion range of 63 to 65. Historically when this index has topped this range, the Valley has experienced a rapid employment growth in the following 6 months. And we are so very close to that threshold.
The average business participating in the survey is planning to hire 1.0 new employees in the next 6 months, an increase over January’s 0.7, however, still short of the October 2013 period when the plans were to hire 1.4 more people in the next 6 months. The more reliable index for forecasting employment over the next 6 months is the moving average of the index which is now running slightly below 1.0 which is a strong indicator for future employment.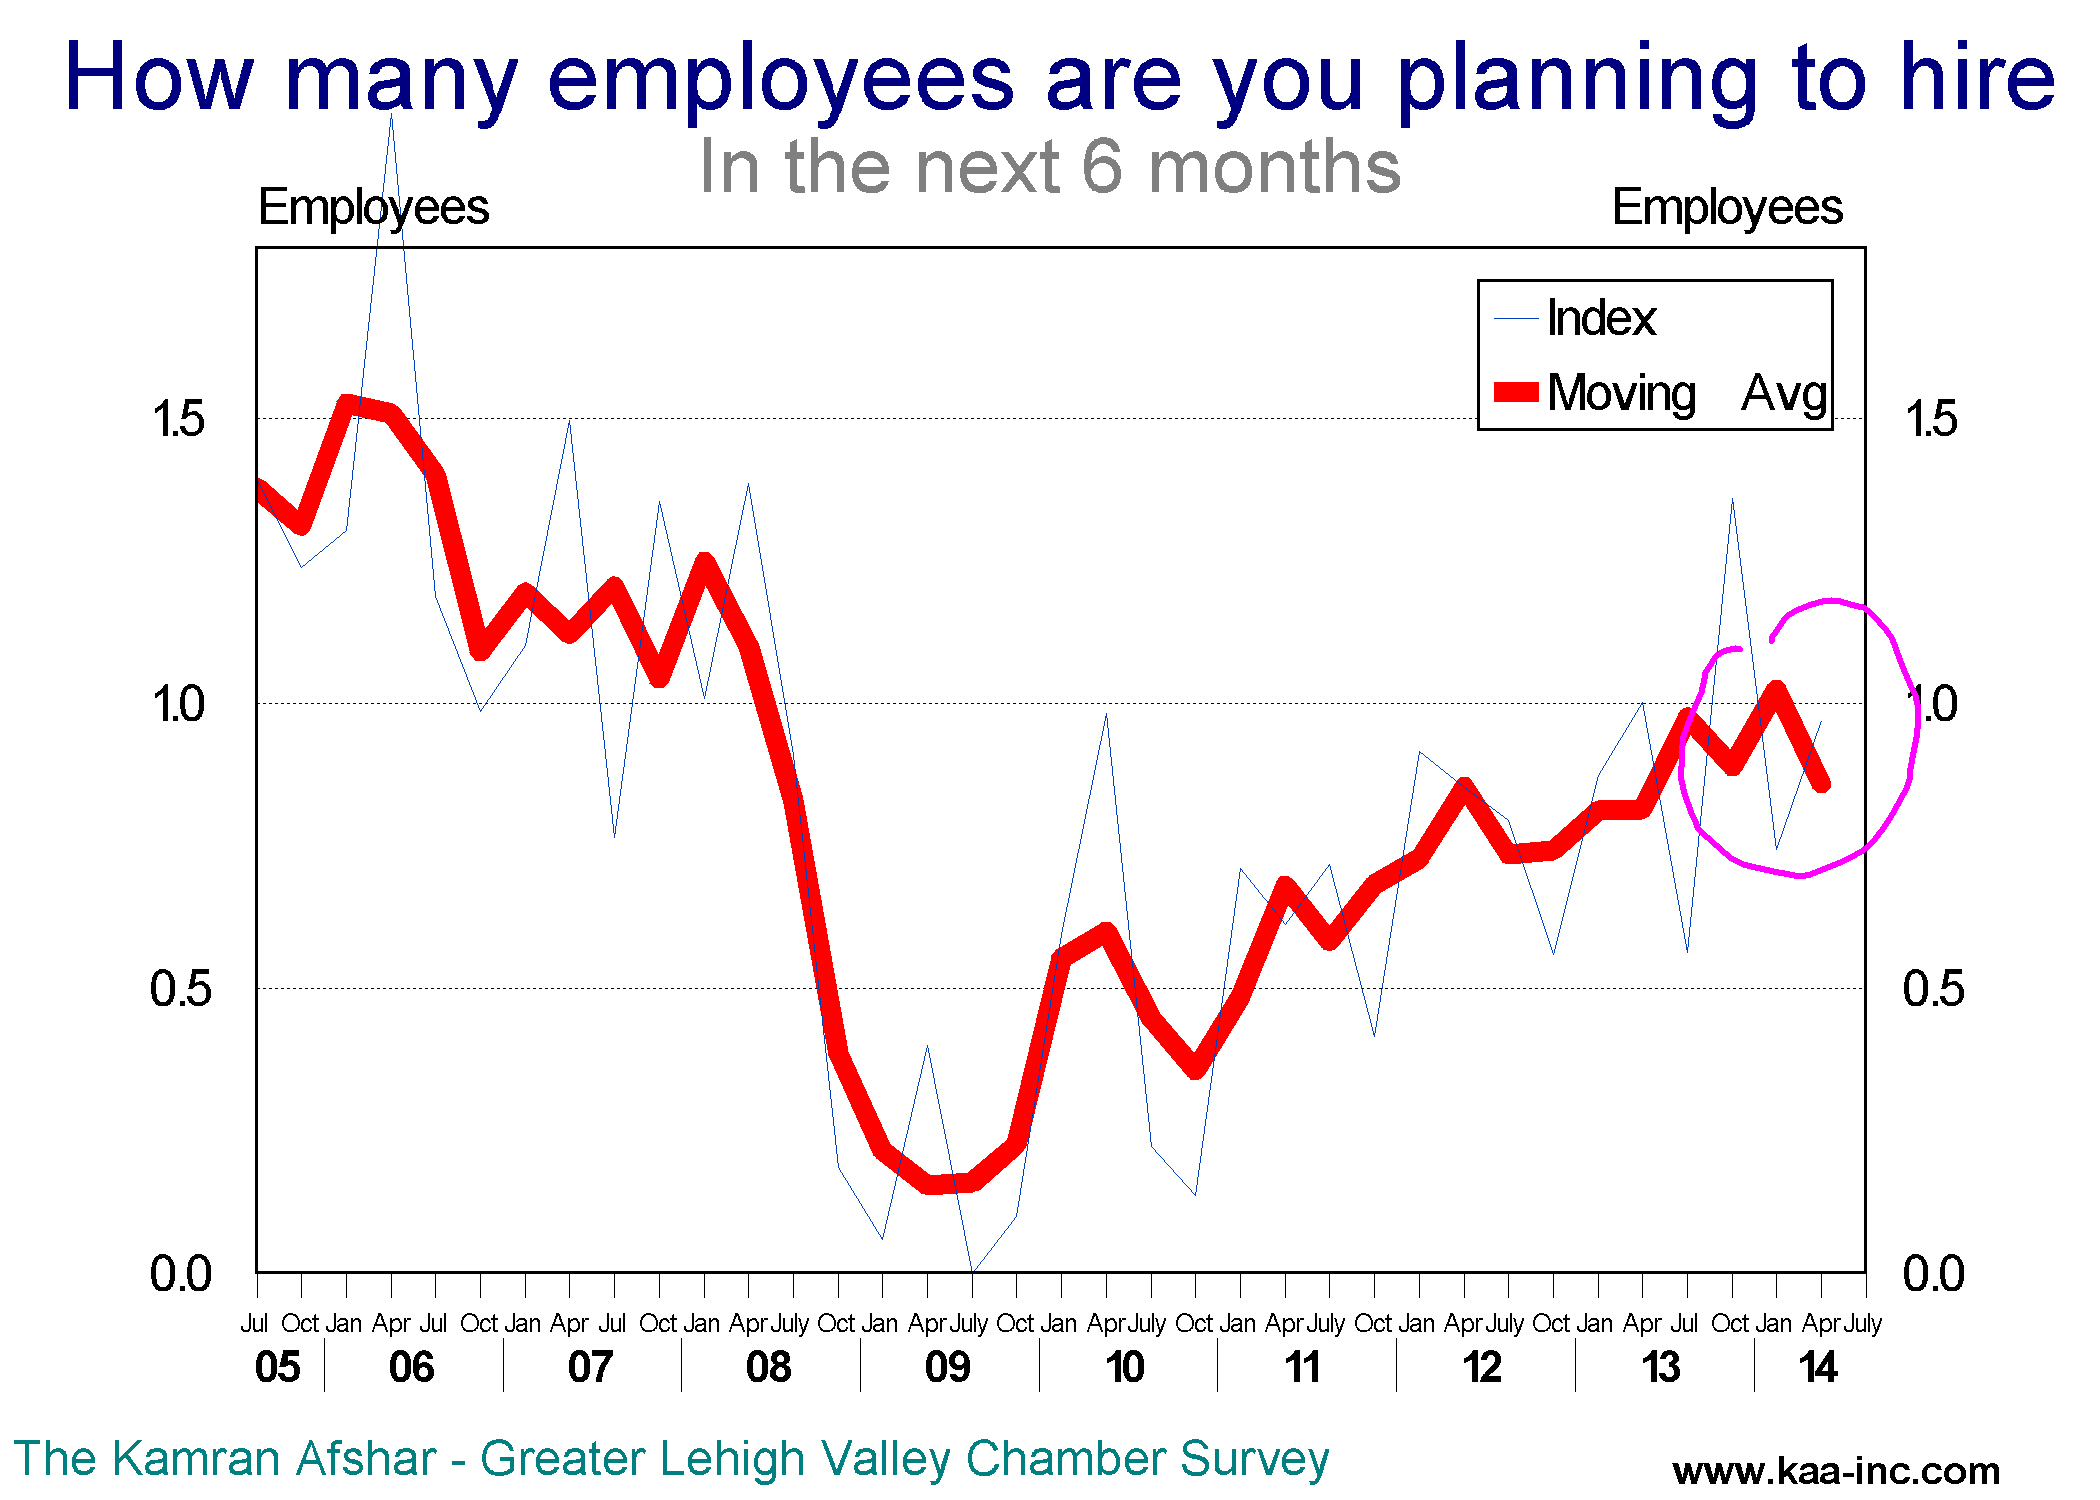
The percentage of the companies which are planning to increase their employment in the next 6 months was 27.8, compared to 5.7% that are planning to reduce employment at their site. The percentage of companies with plans for net increase gain in employment in January was 22.1%, which is also a very strong indicator for future employment.
The index of actual hiring during the last 6 months also rose in April, leveling at 57.8 while only 1.9% above its January level, however, it stands at whopping 7.1% above its April 2013 level. This is the highest post recession level for this index. The average business participating in the survey hired 0.9 new employees in the last 6 months.
The percentage of the companies which increased their employment has been exceeding those who reduced theirs since April 2010. And in general, the percent of those increasing has risen more than those decreasing since the end of the recession.
Conversely, the percentage of those decreasing employment has gone down more than up during the same period.
In April 28.7% of the participants in our survey increased their employment while 11.1% reduced theirs. The percentage of companies with net gain in employment in October was 17.6%.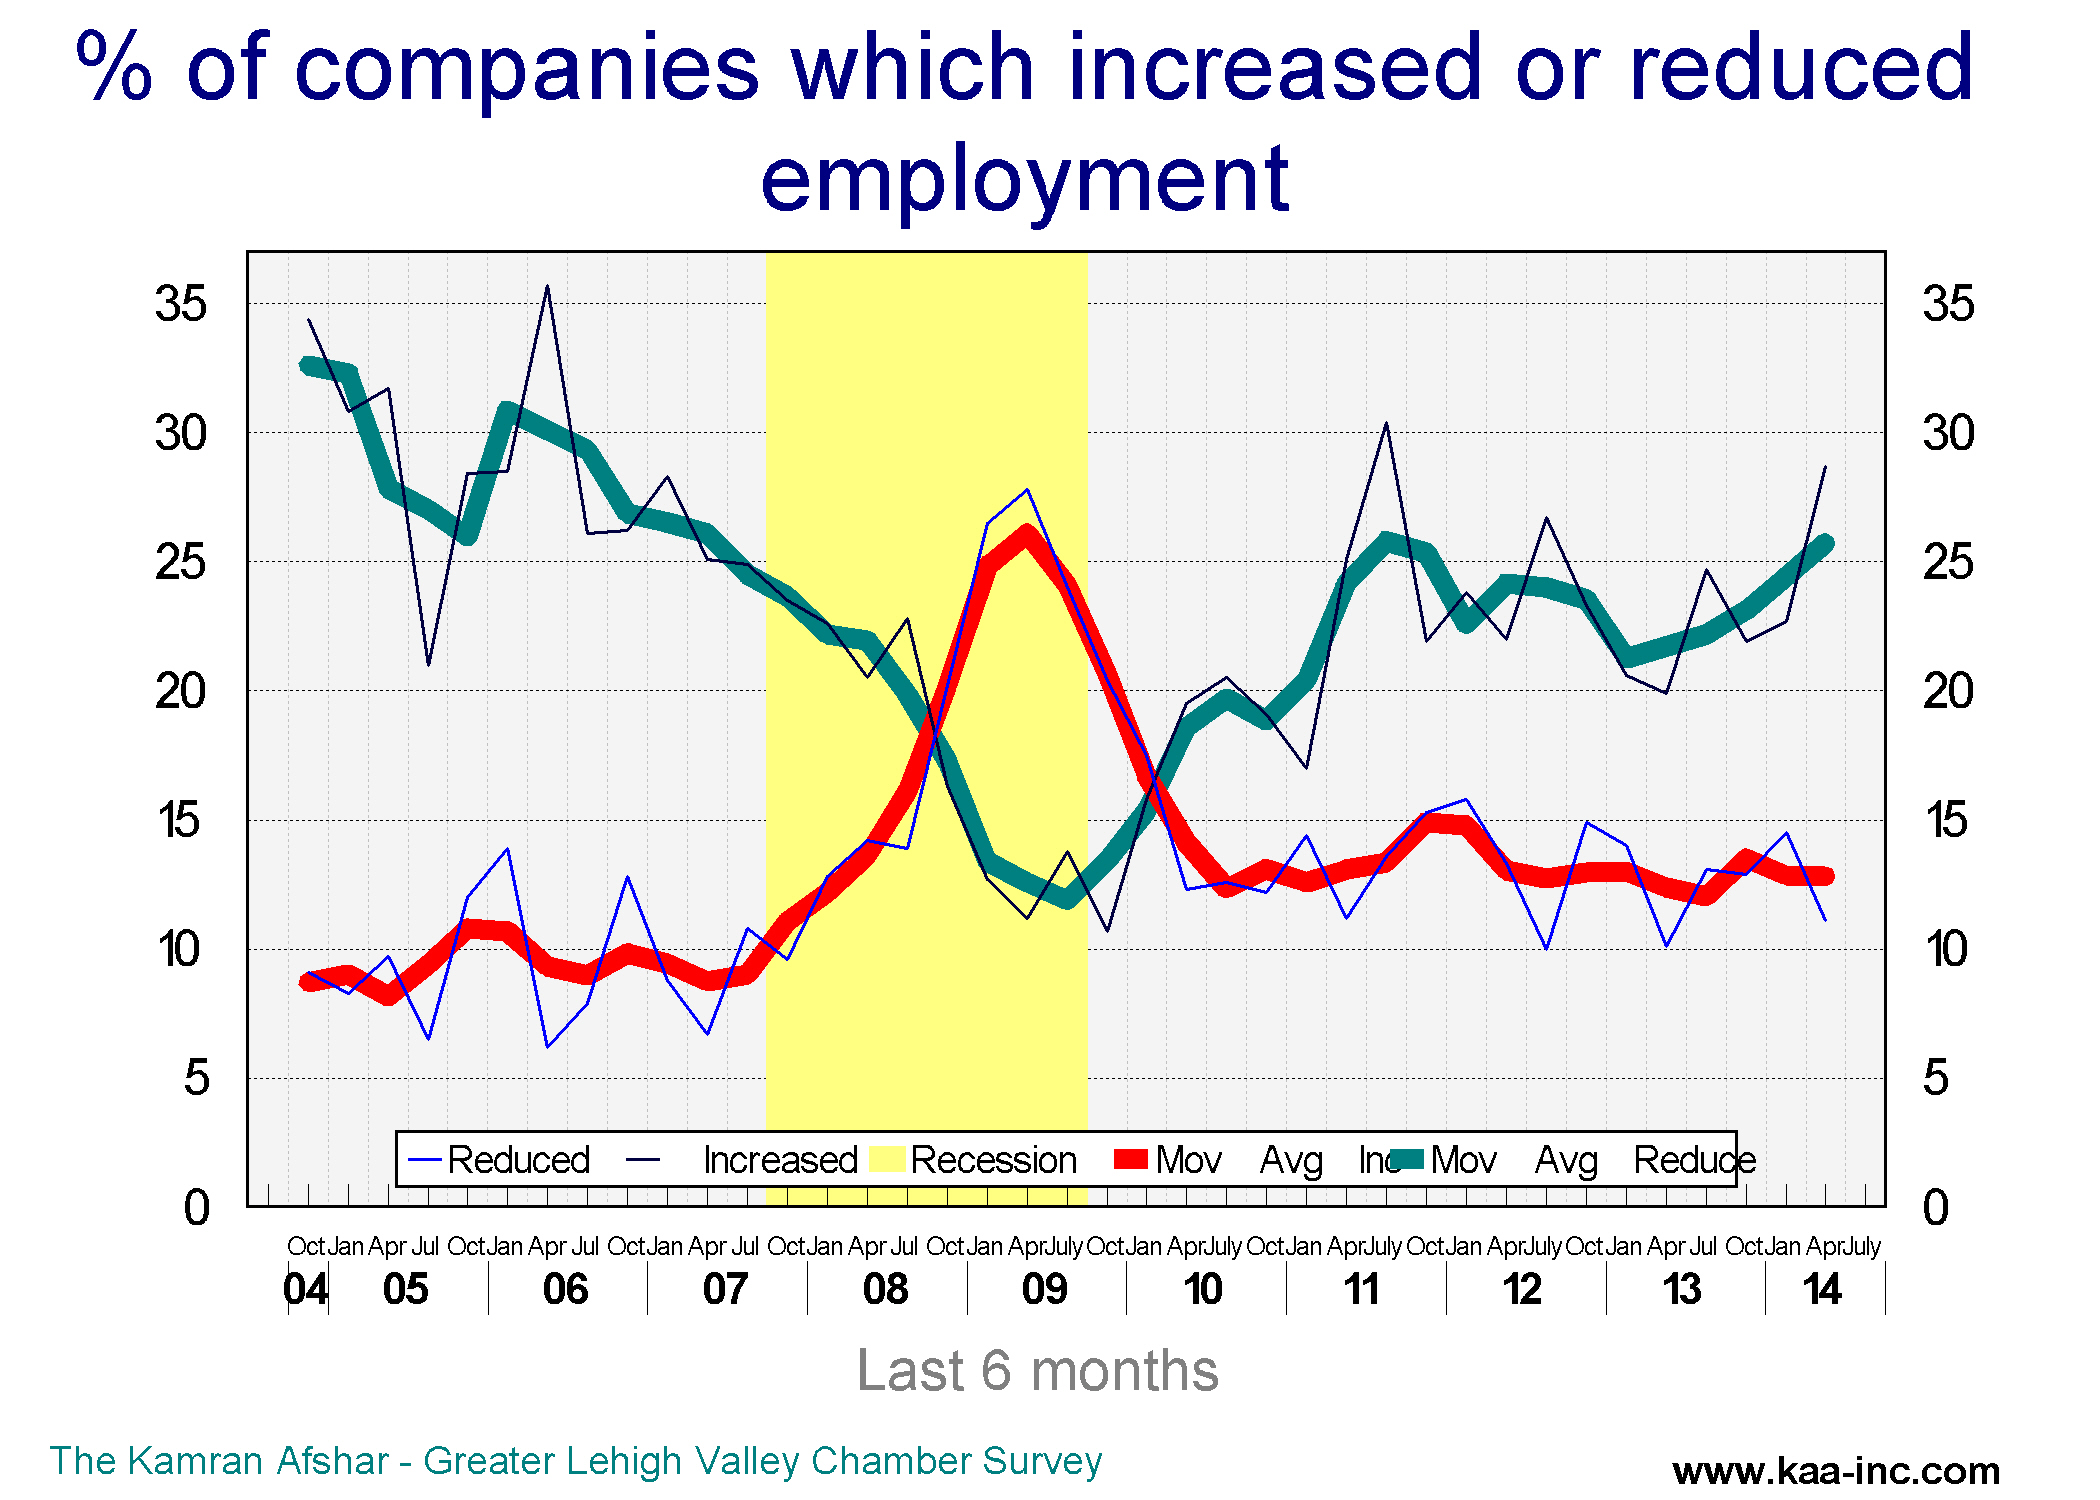
The index of actual purchases in the last 6 months represents “where the rubber meets the road.” An average company participating in our January 2014 survey reported a 1.8% increase in their expenditures in the last six months, a significant increase above January of 0.2%. The index for actual purchases in the last 6 months stood at 59.1 in April a slight increase over January’s 58.3 and a 2.7% increase over last April’s level.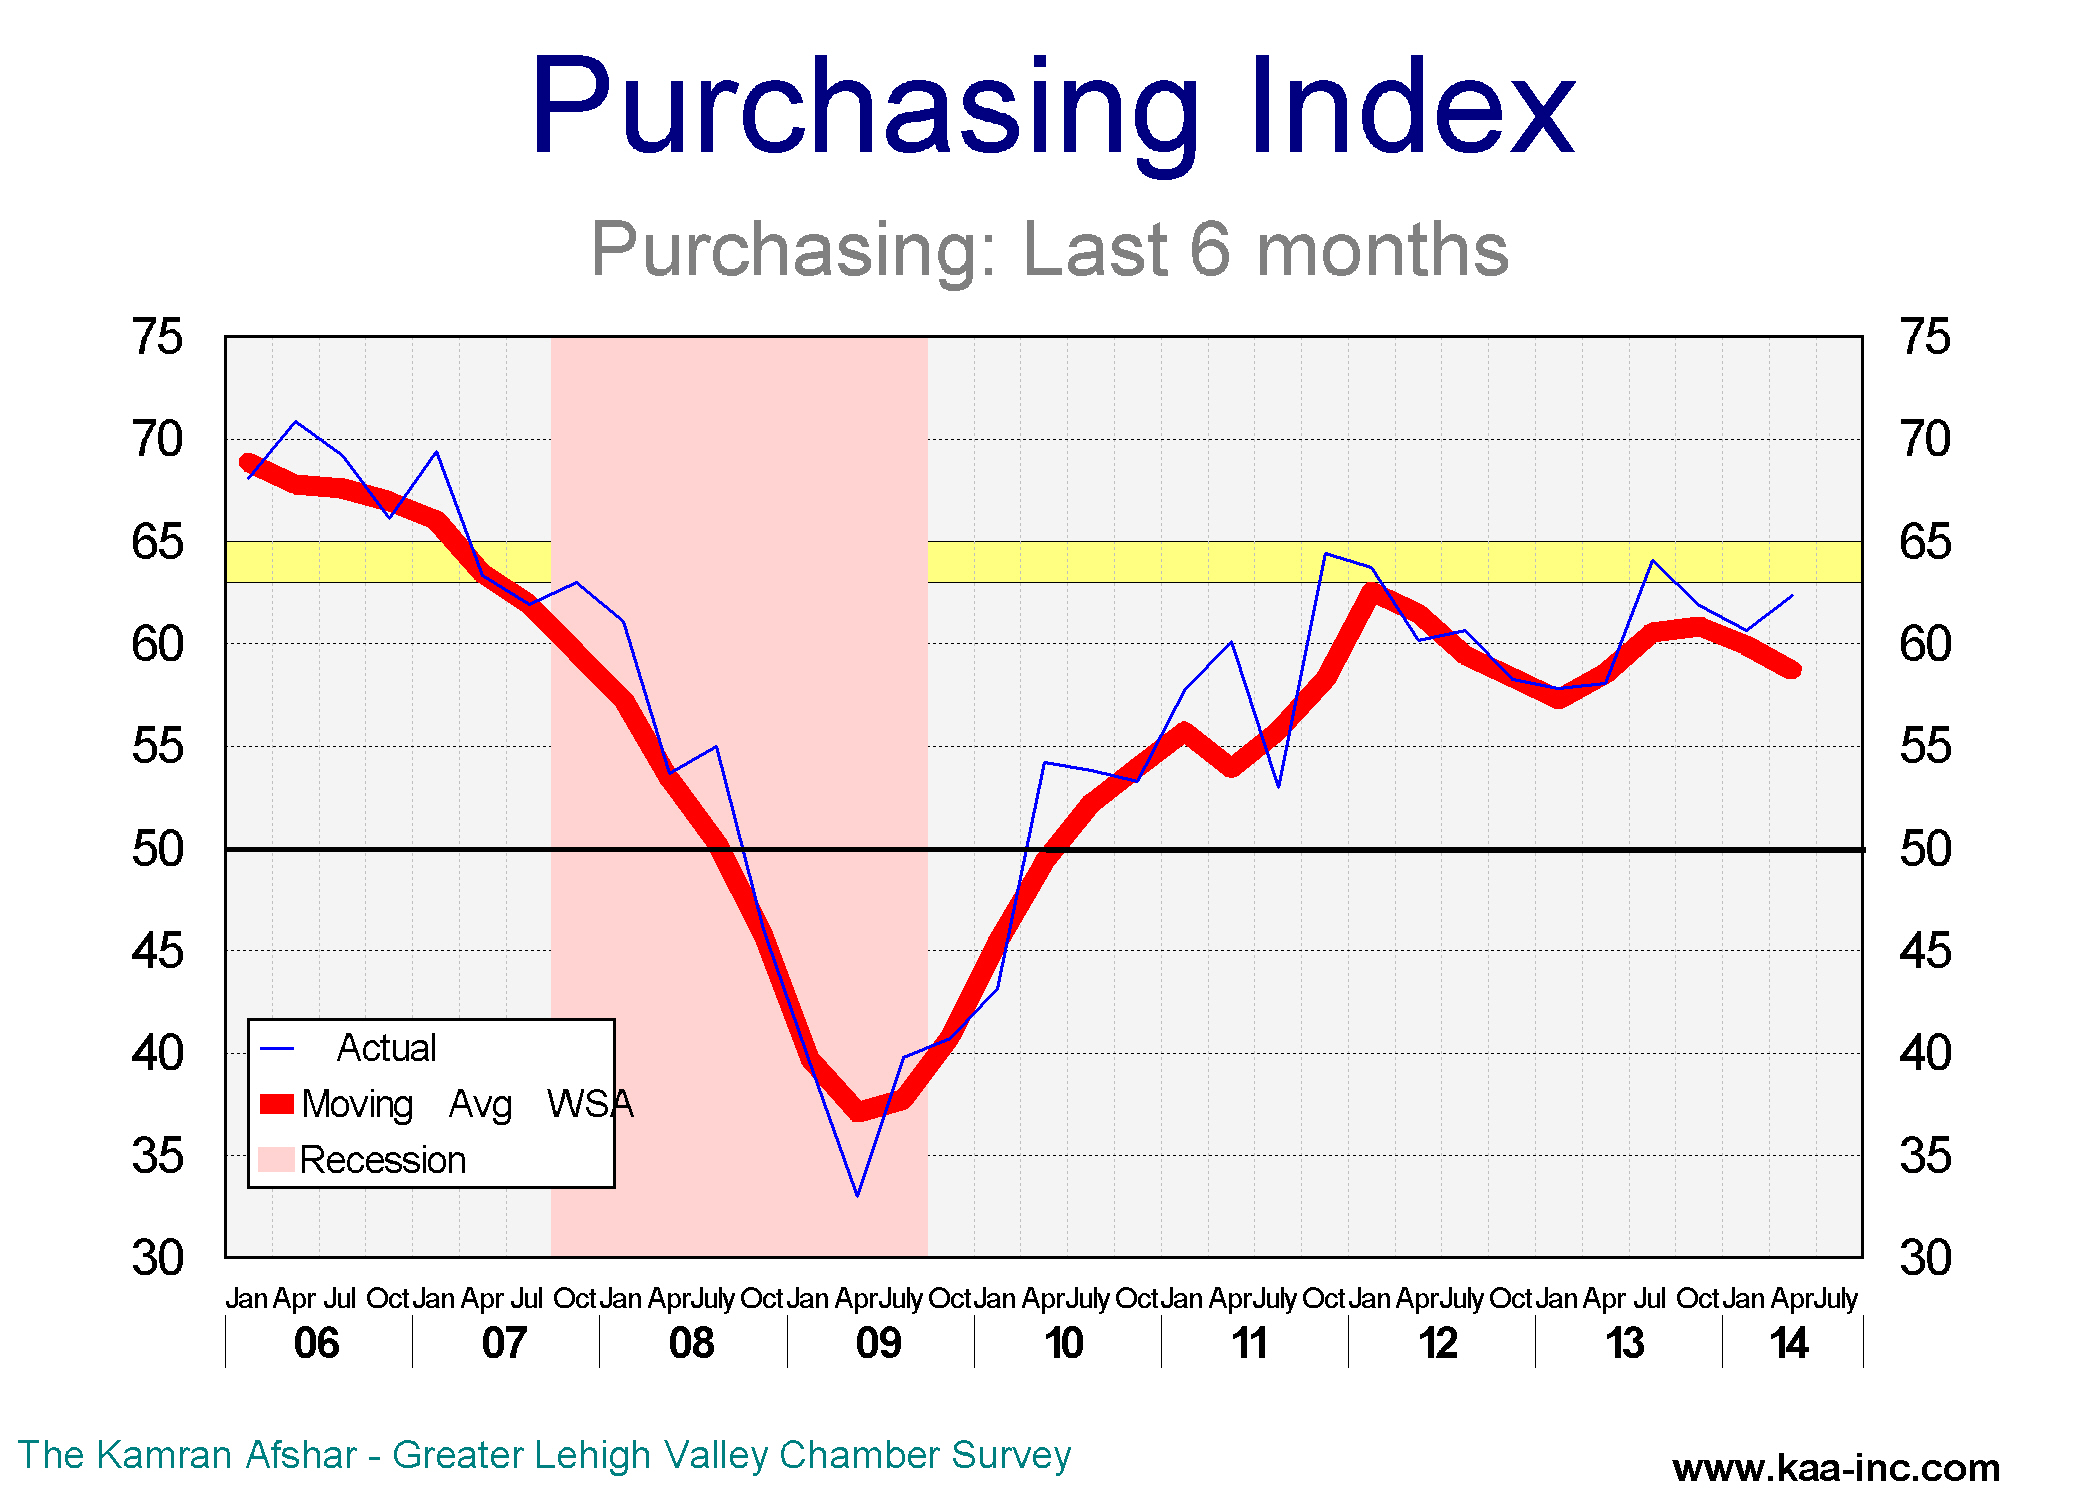
The surprising index is the index of plans for future expenditures dropped sharply to 54.7 in April after and equally sharp drop in January. This index has dropped by 13.7% since October 2013. Considering all the other variables, this is odd. Particularly since the average participant in the survey upped their plans for increasing their expenditures to 3.5% in April from 1.1% in January. Even when this index was at its post recessionary high average in October 2013, average participant was planning to increase their expenditures by only 1.7%,
The issue appears to be the defusion index, while the overall index shows very slow increase in the percentage of the companies who are planning to expand in the next 6 months, those who are expanding are doing it at an increasing rate. Those businesses in the Valley who are expanding, are raising their rate of expansion, while others are very slowly joining the fast lane.
Based on the data over the last 12 month we expect the rate of growth of the economy in the Valley to grow, however, this is clearly not across the board and the distance between leaders and followers is widening and is expected to widen even further during 2014.
What is the real level of unemployment

According to the January 2014 jobs report, there has been 7.8 million jobs created since the depth of the recession, clearly coming up short by approximately 2.3 million new jobs.
As of January there were 10.2 million people who are considered officially unemployed, that is they want a job, and are available and have also actively looked for a job in the last 4 weeks. Out of this 10.2 million, a third of them have been unemployed for more than 27 weeks.
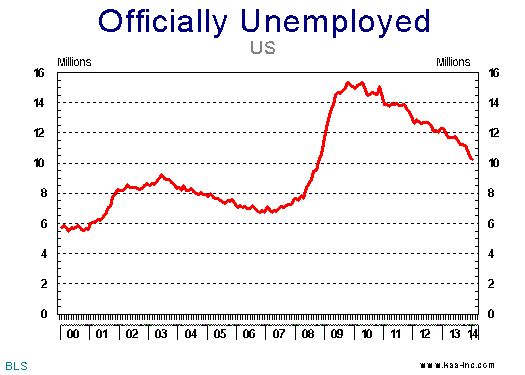
At its worst, there were 6.8 million people who were unemployed for more than half a year. This number has been declining rapidly and as of January 2014 it has been cut to half of what it was at its peak. Still a solid 3.6 million people have been unsuccessfully searching for a job for more than half a year. It should also be noted that for a variety of reasons there are always some unemployment, from people are actually between jobs to those have lost their jobs to technology, changing in markets, etc. For example, even in 2006-07 there were still around 6.5 million people who were counted as unemployed. So when we are looking at the total numbers it is not that we expect unemployment to drop to zero, 6.5 million will do fine!
But this doesn’t paint the real picture of unemployment. During the recession, 8.7 million people lost their jobs, this forced large numbers to accept part-time jobs just to make ends meet. And new comers to the labor market also had a hard time finding full-time jobs. The Bureau of Labor Statistics estimate that there are still 7.3 million people who are “involuntarily” holding part-time jobs.
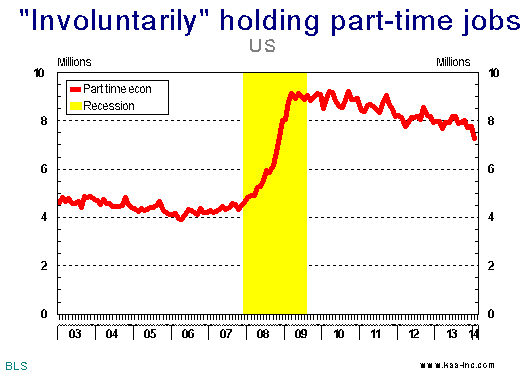
Obviously since these people work, even if it is only one hour a week, we don’t count them as unemployed. There are always people who are holding part-time jobs while looking for a full time one, during the 2006-07 period there were 4.2 million people who were in this position, accordingly we don’t expect all of these jobs to be translated into full time jobs; if only 3 million of them are upgraded we will be back to the pre-recession times for this category.
Government’s definition of employed is very broad, it is as if it was designed to under estimate total unemployment. Which incidently is not far from the truth. The way it works is that if have done ANY work during the last week, congratulations; you are considered employed! In many cases, you are considered employed if you worked for one hour during the last week even if you were not paid for the work. So it takes some doing to be counted as unemployed! For example, let’s look at the case of 1.8 million people who want and are available to work and had looked for a job but not in the last 4 weeks, they are not considered part of the labor force, so they are not counted as unemployed. It should be noted that this is separate from the case of 837 thousand people who have been discouraged and are not looking for a job. They are also not counted as unemployed.
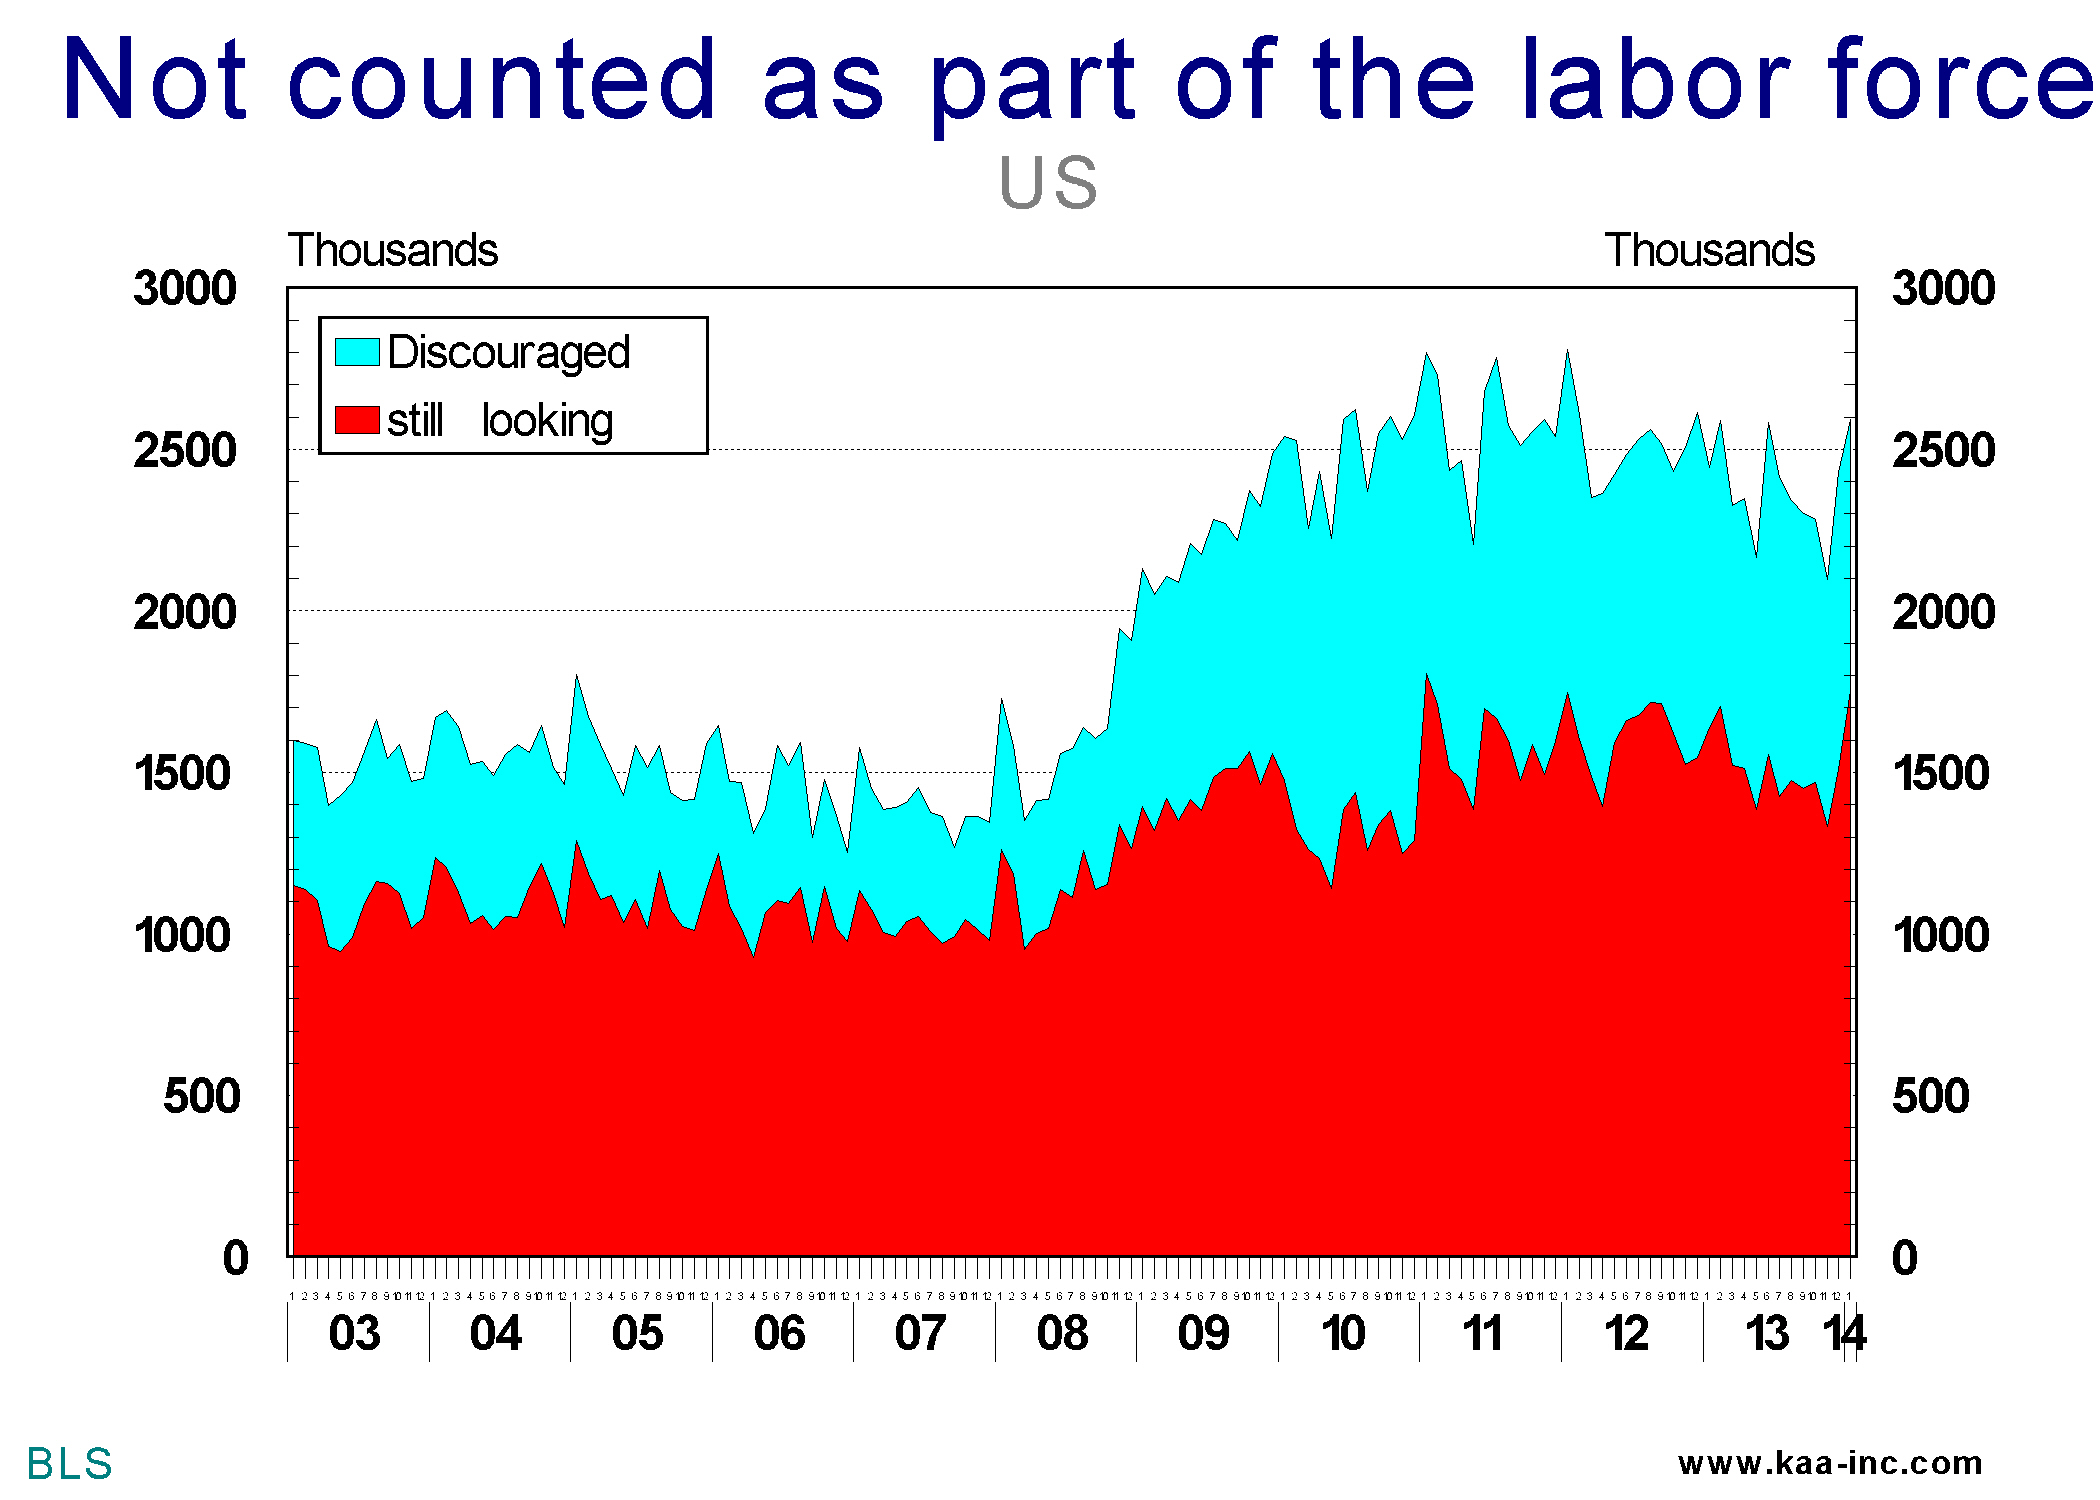
So, the number of those who are really unemployed goes well beyond those who are officially categorized as unemployed. If we add the number of discouraged workers to those who want a job and are available and have looked for one, but not in the last 4 weeks to the number of people who are working a few hours a week but seriously want a full time job, the total for this group is 10 million people. It should be noted that during the 2006-07 period, there were close to 6 million people in these categories.
The reality is that the total number of unemployed is much larger than the 10.2 million announced by the Bureau of Labor Statistics, the real number is somewhere north of 13 million and it could be as high as 20 million people. However, and equally important we need to recognize that there are always a large number of people in these categories due to structural unemployment and many other reasons. What we are looking for is how far are we off what we used to call NORMAL?
In 2006-07, there were 6 million people in unofficially unemployed categories. There were also another 7 million people who were considered as officially unemployed. So out of the 20 million people who are currently officially and unofficially unemployed, approximately 6 million are carried over from 2006-07. Accordingly, we need to drop unemployment by 7 million people to get back to where we were in 2006-07 period, a herculean task under most circumstances, but almost impossible with the current Congress
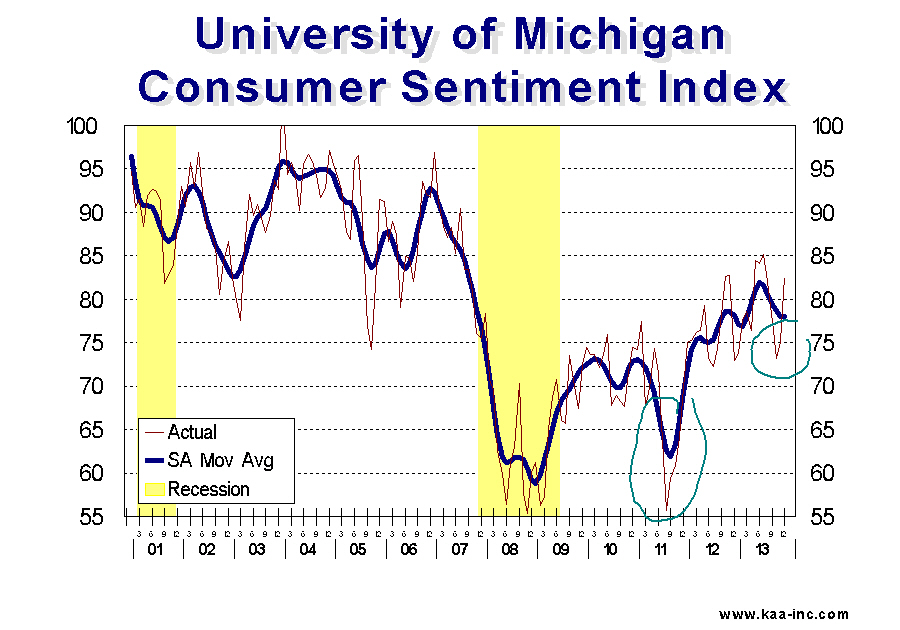
Consumer Sentiment Index up
Consumer Sentiment Index rose by 10% in December, while still below its early summer levels, it is a whopping 13% above its last year’s level.
This improvement in consumer outlook is shared equally between households with higher as well as lower income levels. And according to the researchers, the end of government shutdown, slight improvement in personal finances and the increase in the value of homes and stock market on top of sales discounts gave consumers a higher confidence toward purchases.
The gain in personal finances is mostly due to the increase the stock market which is enjoyed primarily by the top income level households.
Consumers’ outlook on the job market for 2014 is positive, they expect unemployment rate to drop due to strengthening economic conditions.
While consumers expect employment to increase, they do not anticipate their income to increase significantly, actually they expect their raises for 2014 to be less than the rate of inflation
According to the researchers, consumers’ attitude toward buying homes, cars and consumer durables improved in December
These are all great news for the economy, with the qualifier that consumer confidence was higher than now back in July, and political shenanigan cut it down by 12%. Despite the budget agreement and the appearance of some adult supervision in Washington, according to the researchers, consumer confidence in Washington’s economic polices has not improved.
The FED has pumped a trillion dollars a year into the bond market for a while with the hope that it will cause the stock market to rise and as the result of that consumers will feel wealthier and that will induce more consumer expenditures. At least that is the theory. It is however, astonishing to see that the most rapid stock market gains happened this year and after the FED announced that it may taper its monetary injections into the bond market 6 months ago.
There is no doubt that the FED’s liberal monetary policy pumped up the stock market, but there appears that there are real improvements in the economy which are also helping the stock market up.
Local Businesses are planning to increase their expenditures over the next 6 months.
The Kamran Afshar- Greater Lehigh Valley Chamber of Commerce survey of Lehigh Valley businesses is done on a quarterly basis and collects around 700 observations per year. The Employment and Purchasing Index for the Lehigh Valley highlights the results of these surveys.
In July 2016 we conducted our 67th quarterly survey of these series, and according to the survey, business sentiment and the overall confidence in the local economy remained the same as in April, however, it is slightly lower than its January level. The index peaked back in October 2015.
.
In July, the index of plans for future purchases rose by a significant 5% above its April’s level. And while it is still lower than its January’s level, some of its April decline has been reversed.
Actual expenditures over the last 6 months, however, have been trending down since last October.
Hiring plans index for the next 6 months, is a shade higher than its April level, however, it has been trending at an almost constant level for the last year-and-a-half. And of more importance, this level is very close to the range which is historically associated with strong employment growth.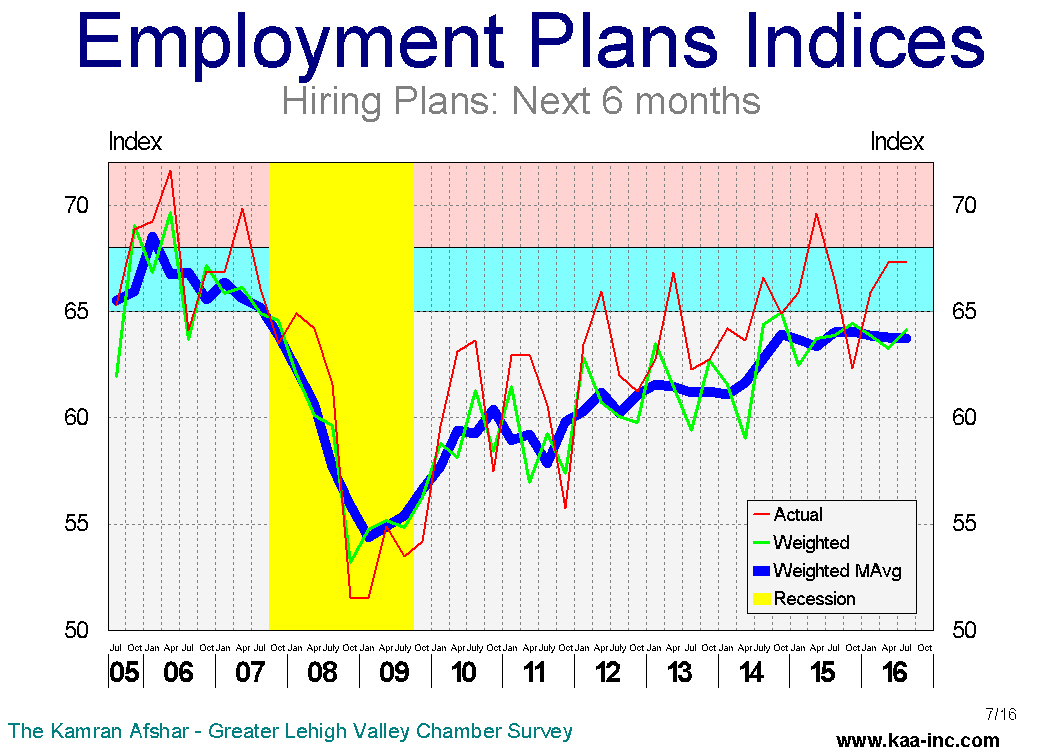 A third of local businesses are planning to hire more people, while only 5% of them plan to lay off employees in the next 6 months. The layoff plans are now similar to what they used to be before the recession.
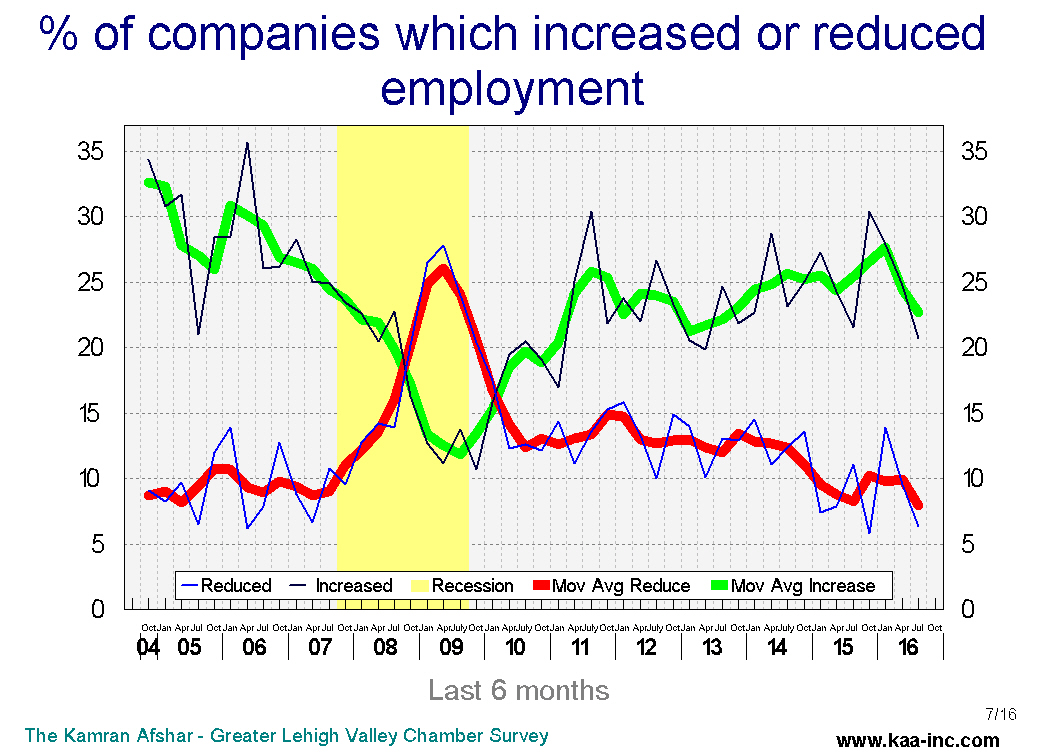
Businesses with more than 100 employees, followed by those with 21 to 50 employees are planning to hire more people in the next 6 months than others.
Similar to the future plans for hiring, the actual hiring index over the last 6 months was almost the same as its April level, but unlike the future hiring plans, the actual hiring index has dropped below its January level.
In July businesses with more than 100 employees reported hiring more people in the last 6 months than the others.
The index of expected revenues is continuing its rebound from its January lows and it is running at its highest level over the last 5 quarters.
The index of actual revenues, rose above its April level, however, it is still running below its January 2016 level.
The overall confidence in the local economy has dropped since last October and some of this decline can be attributed particularly to the increase in the level of uncertainty generated by this election process. We have observed declines in business confidence in previous general elections over the last 16 years. The Valley’s economy is expected to suffer some anxiety over the next few months as election campaigns further ratchet up their activities. However, since our labor market is running close to where it was during the tight labor markets of 1999-2000 and 2004-05 and an increasing number of businesses are reporting more unfilled job openings, it appears that we would weather this election with minimal, if any negative economic impact locally